Completes Kati 1A Ahead of Schedule, Advances Kati 2 AI JV
ALBANY, NY, May 18, 2026 – Soluna Holdings, Inc. (“Soluna” or the “Company”) (NASDAQ: SLNH), a developer of green data centers for intensive computing applications, including Bitcoin mining and AI, announced its financial results for the first quarter ended March 31, 2026.
“Our fourth consecutive quarter of sequential revenue growth and 58% year-over-year increase reflects the operating leverage we’re building across the portfolio. With Kati 1 now contributing, Dorothy 1A back at full capacity, and Dorothy 2 fully ramped, we’re entering the next phase of Soluna’s growth from a position of operational strength,” said John Belizaire, CEO of Soluna Holdings.
“Our AI expansion at Kati 2 is well underway, while Briscoe Wind now vertically integrates the power layer supporting Dorothy 3. Together with the full acquisition of Dorothy 1A, these milestones position Soluna for sustained growth and accelerating momentum,” Belizaire continued.
Q1 2026 Operational and Corporate Highlights:
- Project Kati 1A Reaches Completion Ahead of Schedule – All three phases of Project Kati 1A, totaling 48 MW, reached completion ahead of schedule, supported by $10.9 million in project-level financing from Spring Lane Capital.
- Project Kati 2 Advances with AI Partnership – Soluna partnered with Metrobloks to unlock 100+ MW of AI and HPC capacity, secured 500+ acres of additional land, advanced Phase 1 to 30% schematic design, and began procurement of long-lead equipment for the up to 300 MW+ site.
- Project Dorothy 1A Fleet Upgrade Completed – Soluna completed a 20 MW fleet upgrade at Dorothy 1A, returning the site to full capacity and improving fleet-wide efficiency.
- Expanded Blockware Partnership at Project Dorothy 1A – Soluna expanded its hosting relationship with Blockware, adding 6 MW at Project Dorothy 1A, strengthening utilization at the site.
- Development Pipeline Surpasses 4.3 GW – Soluna’s pipeline grew to 4.3 GW through new and expanded IPP partnerships, anchored by an AI-focused pipeline including Kati 2 (300 MW+), Dorothy 3 (300 MW+), and early-stage greenfield sites across the U.S.
- Michael Picchi Appointed Chief Financial Officer – Soluna appointed Michael Picchi as CFO, effective April 1, 2026.
First Quarter Financial Highlights:
- Revenue increased sequentially for the fourth consecutive quarter from $9.2 million to $9.4 million. On a year-over-year basis, revenue increased 58%, driven by Dorothy 2 energization, Dorothy 1A revenue growth, and Kati 1 going live, partially offset by hashprice compression at Dorothy 1B.
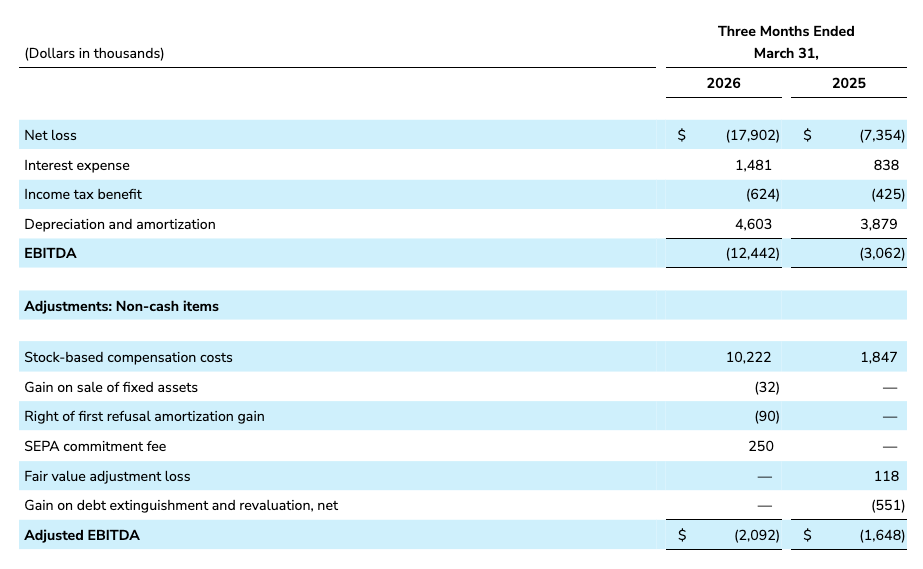
- Net loss increased ($10.5 million) YoY to ($17.9 million), driven by higher equity compensation, interest, and financing expenses, partially offset by site-level operating improvement. EBITDA loss declined ($9.4 million) YoY to ($12.4 million) on the same drivers. After adjusting for stock-based compensation, SEPA commitment fees, and minor asset sale gains, Adjusted EBITDA loss fell modestly ($444 thousand) YoY to ($2.1 million).
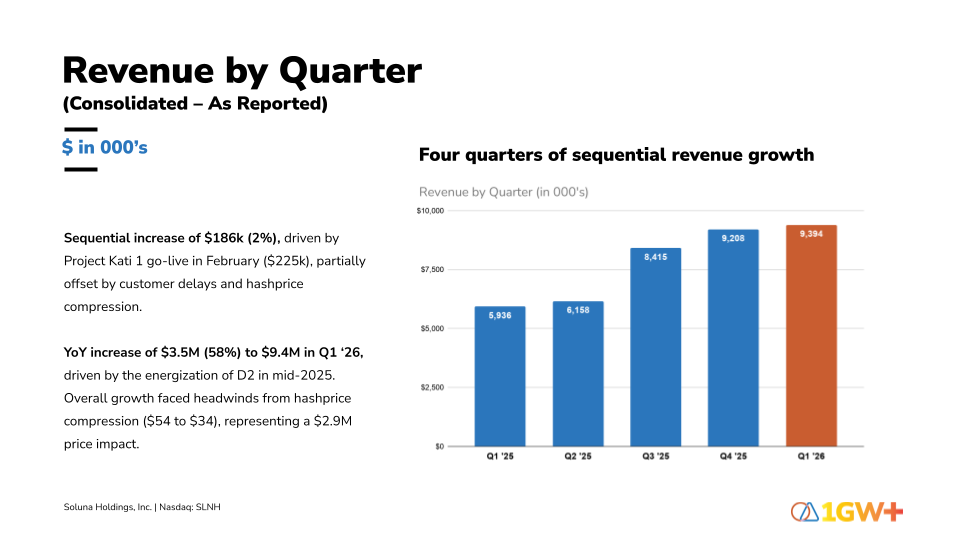
- Revenue for the three months increased by 2% or $186 thousand from Q4 2025 to Q1 2026 – driven by Project Kati 1 going live in February and new Dorothy 1A customer additions, partially offset by an -18% hashprice decline ($42 to $34) on proprietary mining and profit share revenue.
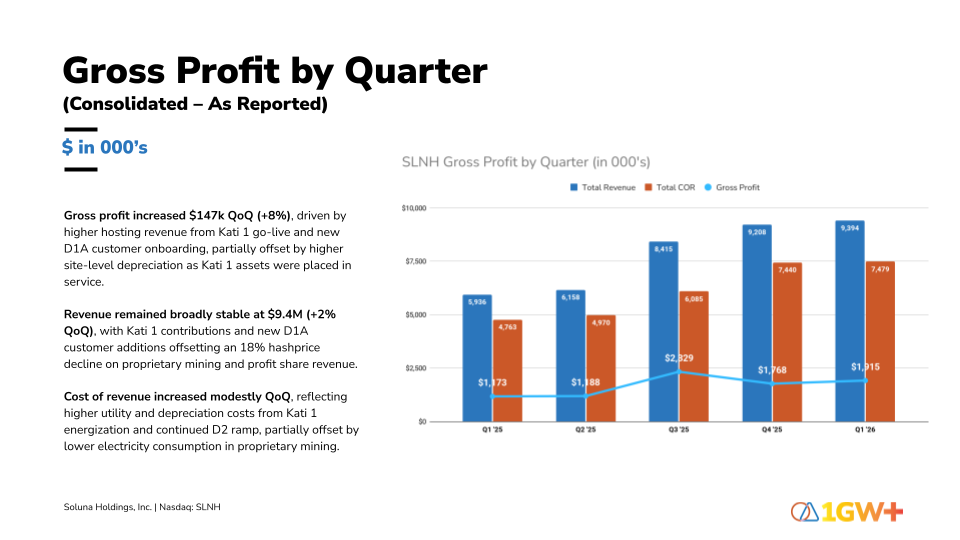
- Q1 2026 Gross Profit increased sequentially from $1.8 million to $1.9 million, driven by higher hosting revenue, partially offset by higher site-level depreciation as Kati 1 assets were placed in service.
- Dorothy 1A, Dorothy 2, and Sophie delivered strong gross margins of 36%, 41%, and 37%, respectively.
- Dorothy 1B generated a (15%) gross margin loss, driven by hashprice compression.
- Kati 1 reported a $262 thousand loss in its first quarter of operations, reflecting ramp-up costs ahead of meaningful revenue.
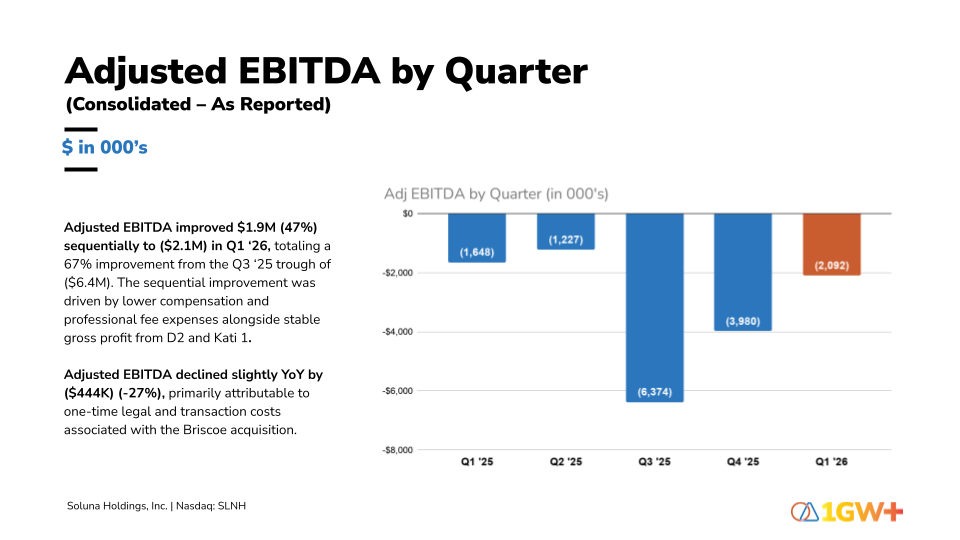
- Net loss for Q1 2026 increased $1 million sequentially to $17.9 million. However, adjusted EBITDA loss improved from Q4 2025 to Q1 2026 to ($2.1 million) – increased by $1.9M (47%) sequentially, driven by lower compensation and professional fee expenses alongside stable gross profit from Dorothy 2 and Kati 1.
- Adjusted EBITDA loss declined from Q1 2025 to Q1 2026 by ($444 thousand) – primarily due to non-recurring costs associated with legal and transaction costs from the Briscoe acquisition.
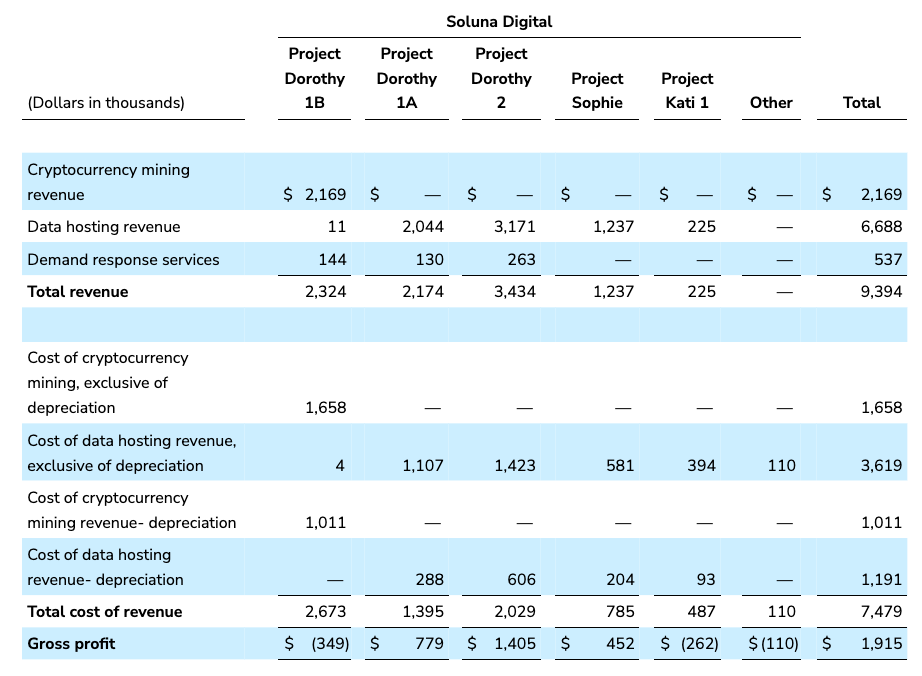
Q1 2026 Revenue & Cost of Revenue by Project Site
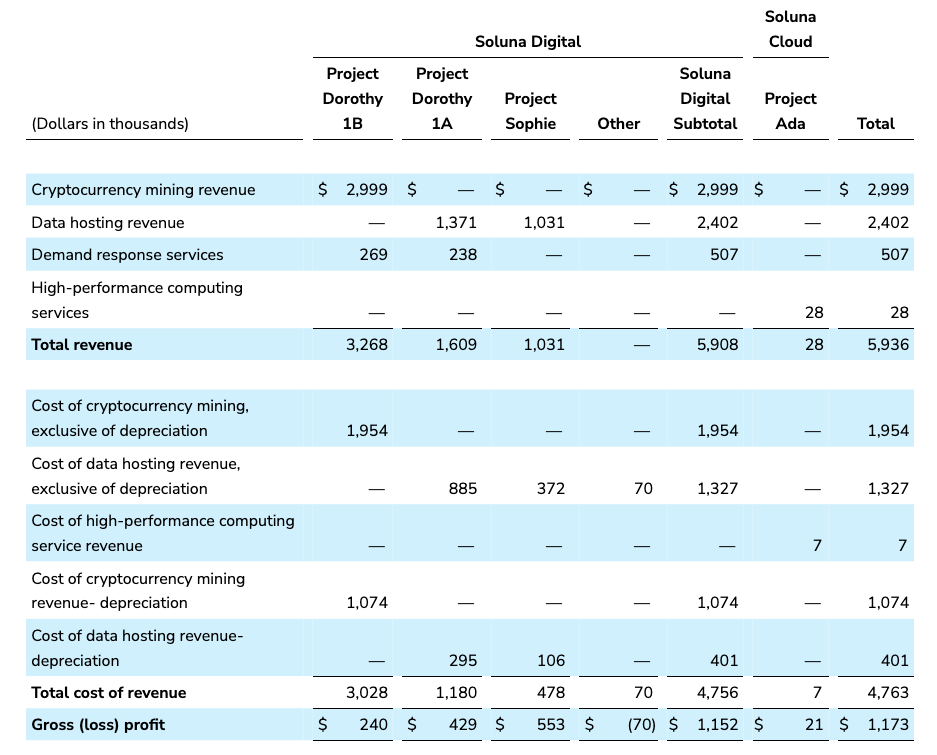
Q1 2025 Revenue & Cost of Revenue by Project Site
Subsequent Events:
- Acquired 150 MW Briscoe Wind Farm for $53 Million – Soluna acquired the Briscoe Wind Farm, achieving full vertical integration at Project Dorothy and securing the energy foundation for the planned 300 MW Dorothy 3 AI campus. Financed through $12.5 million from Generate Capital and cash on hand, the acquisition is projected to generate $6 million to $11 million in Year-One Adjusted EBITDA and $20.0 million to $24.4 million in annualized revenue.
- Acquired Full Equity of Project Dorothy 1A – On April 15, 2026, Soluna purchased 85.4% of the issued and outstanding Class B Membership Interests in the Dorothy 1A bitcoin mining project for $16.5 million, paid in two installments and partially funded by $12 million in unsecured debt. With this acquisition, Soluna now wholly owns Project Dorothy 1A.
- Project Kati 1B Underway – Cormint containers have arrived on-site with the first 12 MW phase installation now underway, advancing the buildout at the Kati complex.
- Launched Development for Dorothy 3 AI Campus – Soluna began marketing Project Dorothy 3, a planned 300+ MW AI/HPC campus adjacent to its Dorothy 1, Dorothy 2, and Briscoe Wind Farm assets near Silverton, Texas. The project represents the next phase of Soluna’s vertically integrated renewable computing strategy.
- KPMG Named as Independent Auditor – Soluna appointed KPMG as its new independent registered public accounting firm.
The unaudited financial statements and Quarterly Report on Form 10-Q for the three months ended March 31, 2026, filed with the U.S. Securities and Exchange Commission (“SEC”) on May 15, 2026, are available online.
Our current Investor Presentation is available here.
Soluna’s glossary of terms is available here.
Safe Harbor Statement
This announcement contains forward-looking statements. These statements are made under the “safe harbor” provisions of the U.S. Private Securities Litigation Reform Act of 1995. These forward-looking statements can be identified by terminology such as “will,” “expects,” “anticipates,” “future,” “intends,” “plans,” “believes,” “estimates,” “confident,” and similar statements. Other examples of forward-looking statements may include, but are not limited to, (i) statements of Company’s plans and objectives, including the deployment at Kati 2, (ii) statements of future economic performance, (iii) statements regarding financial projections of the Company, and (iv) statements of assumptions underlying other statements about the Company or its business. Soluna may also make written or oral forward-looking statements in its periodic reports to the SEC, in its annual report to shareholders, in press releases and other written materials, and in oral statements made by its officers, directors, or employees to third parties. Statements that are not historical facts, including but not limited to statements about Soluna’s beliefs and expectations, are forward-looking statements. Forward-looking statements involve inherent risks and uncertainties, further information regarding which is included in the Company’s filings with the SEC. All information provided in this press release is as of the date of the press release, and Soluna undertakes no duty to update such information, except as required under applicable law.
Non-GAAP Measures
In addition to figures prepared in accordance with generally accepted accounting principles (“GAAP”), Soluna from time to time may present alternative non-GAAP performance measures, e.g., EBITDA, adjusted EBITDA, adjusted net profit/loss, adjusted earnings per share, free cash flow, both on a company basis and on a project-level basis, among others. EBITDA is defined as earnings before interest, taxes, and depreciation and amortization. Adjusted EBITDA is defined as EBITDA adjusted for stock-based compensation costs, gain on sale of fixed assets and right of first refusal amortization, SEPA commitment fee, fair value adjustment loss, and gain on debt extinguishment and revaluation, net. Project-level measures may not take into account a full allocation of corporate expenses. These measures should be considered in addition to, but not as a substitute for, the information prepared in accordance with GAAP. Alternative performance measures are not subject to GAAP or any other generally accepted accounting principles. Other companies may define these terms in different ways. See our annual report on Form 10-K for the year ended December 31, 2025, for an explanation of how management uses these measures in evaluating its operations. Investors should review the non-GAAP reconciliations provided above and not rely on any single financial measure to evaluate the Company’s business.
About Soluna Holdings, Inc. (Nasdaq: SLNH)
Soluna is on a mission to make renewable energy a global superpower using computing as a catalyst. The company designs, develops, and operates digital infrastructure that transforms surplus renewable energy into global computing resources. Soluna’s pioneering data centers are strategically co-located with wind, solar, or hydroelectric power plants to support high-performance computing applications, including Bitcoin Mining, Generative AI, and other compute-intensive applications. Soluna’s proprietary software MaestroOS(™) helps energize a greener grid while delivering cost-effective and sustainable computing solutions and superior returns. To learn more, visit solunacomputing.com and follow us on:
LinkedIn: https://www.linkedin.com/company/solunaholdings/
X (formerly Twitter): x.com/solunaholdings
YouTube: youtube.com/c/solunacomputing
Newsletter: bit.ly/solunasubscribe
Resource Center: solunacomputing.com/resources
Soluna regularly posts important information on its website and encourages investors and potential investors to consult the Soluna investor relations and investor resources sections of its website regularly.
Contact Information
Investor Relations
Soluna Holdings, Inc.
Soluna Holdings, Inc. and Subsidiaries
Condensed Consolidated Balance Sheets
As of March 31, 2026 (Unaudited) and December 31, 2025
| (Dollars in thousands, except per share) | March 31, 2026 | December 31, 2025 | |
| Assets | |||
| Current Assets: | |||
| Cash | $ 68,572 | $ 76,423 | |
| Restricted cash | 9,493 | 4,500 | |
| Accounts receivable, net (allowance for expected credit losses of $0 at March 31, 2026 and $244 at December 31, 2025) | 5,456 | 5,522 | |
| Prepaid expenses and other current assets | 4,178 | 2,664 | |
| Loan commitment assets | 3,018 | 3,018 | |
| Total Current Assets | 90,717 | 92,127 | |
| Restricted cash, noncurrent | 7,920 | 7,920 | |
| Other assets | 963 | 978 | |
| Deposits and credits on equipment | 3,333 | 1,377 | |
| Property, plant and equipment, net | 79,516 | 74,783 | |
| Intangible assets, net | 5,932 | 8,261 | |
| Operating lease right-of-use assets | 244 | 252 | |
| Financing lease right-of-use assets | 1,795 | 2,246 | |
| Total Assets | $ 190,420 | $ 187,944 | |
| Liabilities and Equity | |||
| Current Liabilities: | |||
| Accounts payable | $ 4,218 | $ 4,859 | |
| Accrued liabilities | 15,568 | 13,182 | |
| Accrued interest payable | 346 | 303 | |
| Contract termination liability | 19,348 | 19,348 | |
| Current portion of debt | 10,041 | 8,858 | |
| Income tax payable | 129 | 123 | |
| Deferred revenue | 537 | 518 | |
| Customer deposits- current | 1,640 | 1,913 | |
| Operating lease liability | 62 | 65 | |
| Financing lease liability | 22 | 20 | |
| Total Current Liabilities | 51,911 | 49,189 | |
| Other liabilities | 946 | 743 | |
| Customer deposits- long-term | 3,061 | 2,533 | |
| Long-term debt | 15,910 | 17,899 | |
| Operating lease liability | 182 | 187 | |
| Financing lease liability | 1,775 | 2,236 | |
| Deferred tax liability, net | 2,279 | 2,911 | |
| Total Liabilities | 76,064 | 75,698 | |
| Commitments and Contingencies (Note 10) | |||
| Mezzanine Equity: | |||
| Placement agent warrants | 1,313 | 1,313 | |
| Equity: | |||
| 9.0% Series A Cumulative Perpetual Preferred Stock, par value $0.001 per share, $25.00 liquidation preference; authorized 6,040,000; 4,920,045 shares issued and outstanding as of March 31, 2026 and 4,928,545 shares issued and outstanding as of December 31, 2025 | 5 | 5 | |
| Series B Preferred Stock, par value $0.0001 per share, authorized 187,500; 57,190 shares issued and outstanding as of March 31, 2026 and 62,500 shares issued and outstanding as of December 31, 2025 | — | — | |
| Common stock, par value $0.001 per share, authorized 375,000,000; 111,803,635 shares issued and 111,717,040 shares outstanding as of March 31, 2026 and 102,617,684 shares issued and 102,531,089 shares outstanding as of December 31, 2025 | 112 | 103 | |
| Additional paid-in capital | 446,183 | 435,030 | |
| Accumulated deficit | (385,181) | (367,715) | |
| Common stock in treasury, at cost, 86,595 shares at March 31, 2026 and December 31, 2025 | (13,873) | (13,873) | |
| Total Soluna Holdings, Inc. Stockholders’ Equity (Deficit) | 47,246 | 53,550 | |
| Non-Controlling Interest | 65,797 | 57,383 | |
| Total Equity | 113,043 | 110,933 | |
| Total Liabilities, Mezzanine Equity, and Equity | $ 190,420 | $ 187,944 |
The accompanying notes are an integral part of these unaudited condensed consolidated financial statements.
Soluna Holdings, Inc. and Subsidiaries
Condensed Consolidated Statements of Operations (Unaudited)
For the Three Months Ended March 31, 2026 and 2025
| (Dollars in thousands, except per share) | Three Months Ended March 31, |
||
| 2026 | 2025 | ||
| Cryptocurrency mining revenue | $ 2,169 | $ 2,999 | |
| Data hosting revenue | 6,688 | 2,402 | |
| Demand response service revenue | 537 | 507 | |
| High-performance computing service revenue | — | 28 | |
| Total revenue | 9,394 | 5,936 | |
| Operating costs: | |||
| Cost of cryptocurrency mining revenue, exclusive of depreciation | 1,658 | 1,954 | |
| Cost of data hosting revenue, exclusive of depreciation | 3,619 | 1,327 | |
| Cost of high-performance computing services | — | 7 | |
| Cost of cryptocurrency mining revenue- depreciation | 1,011 | 1,074 | |
| Cost of data hosting revenue- depreciation | 1,191 | 401 | |
| Total costs of revenue | 7,479 | 4,763 | |
| Operating expenses: | |||
| General and administrative expenses, exclusive of depreciation and amortization | 16,140 | 5,946 | |
| Depreciation and amortization associated with general and administrative expenses | 2,401 | 2,404 | |
| Total general and administrative expenses | 18,541 | 8,350 | |
| Operating loss | (16,626) | (7,177) | |
| Interest expense | (1,481) | (838) | |
| Gain on debt extinguishment and revaluation, net | — | 551 | |
| Gain on sale of fixed assets | 32 | — | |
| Fair value adjustment loss | — | (118) | |
| Other financing expense | (564) | (201) | |
| Other income, net | 113 | 4 | |
| Loss before income taxes | (18,526) | (7,779) | |
| Income tax benefit, net | 624 | 425 | |
| Net loss | (17,902) | (7,354) | |
| (Less) Net loss (income) attributable to non-controlling interest | 436 | (202) | |
| Net loss attributable to Soluna Holdings, Inc. | $ (17,466) | $ (7,556) | |
| Basic and Diluted loss per common share: | |||
| Basic & Diluted loss per share | $ (0.24) | $ (1.21) | |
| Weighted average shares outstanding (Basic and Diluted) | 84,101,320 | 8,719,351 | |
The accompanying notes are an integral part of these unaudited condensed consolidated financial statements.
Soluna Holdings, Inc. and Subsidiaries
Condensed Consolidated Statements of Cash Flows (Unaudited)
For the Three Months Ended March 31, 2026 and 2025
| Three Months Ended
March 31, |
|||
| (Dollars in thousands) | 2026 | 2025 | |
| Operating Activities | |||
| Net loss | $ (17,902) | $ (7,354) | |
| Adjustments to reconcile net loss to net cash used in operating activities: | |||
| Depreciation expense | 2,229 | 1,506 | |
| Amortization expense | 2,374 | 2,373 | |
| Stock-based compensation | 10,222 | 1,847 | |
| Deferred income taxes | (632) | (437) | |
| Right of first refusal amortization gain | (90) | — | |
| Amortization of operating and finance lease asset | 56 | 15 | |
| Gain on debt extinguishment and revaluation, net | — | (551) | |
| Amortization of deferred financing costs and discount on notes | 436 | 153 | |
| Fair value adjustments, including SEPA | — | 118 | |
| SEPA commitment cost | 250 | — | |
| Gain on sale of fixed assets | (32) | — | |
| Changes in operating assets and liabilities: | |||
| Accounts receivable | 66 | 329 | |
| Prepaid expenses and other current assets | (1,514) | (197) | |
| Other long-term assets | — | 1,606 | |
| Accounts payable | (2,085) | 481 | |
| Contract termination liability | — | (667) | |
| Deferred revenue | 161 | — | |
| Operating lease liabilities | (8) | (15) | |
| Other liabilities and customer deposits | 406 | 374 | |
| Accrued liabilities and interest payable | (309) | 242 | |
| Net cash used in operating activities | (6,372) | (177) | |
| Investing Activities | |||
| Purchases of property, plant, and equipment | (2,565) | (3,534) | |
| Purchases of intangible assets | (45) | (45) | |
| Proceeds from sale of property, plant, and equipment | 32 | — | |
| Deposits on equipment | (3,646) | (61) | |
| Net cash used in investing activities | (6,224) | (3,640) | |
| Financing Activities | |||
| Proceeds from common stock warrant exercises | 8 | — | |
| Proceeds from sale of common stock on SEPA | — | 2,005 | |
| Proceeds from notes | — | 5,000 | |
| Payments on notes and deferred financing costs | (1,001) | (1,978) | |
| Payments on financing lease liabilities | (56) | — | |
| Contributions from non-controlling interest | 10,918 | 4,310 | |
| Distributions to non-controlling interest | (131) | (1,525) | |
| Net cash provided by financing activities | 9,738 | 7,812 | |
| (Decrease) increase in cash & restricted cash | (2,858) | 3,995 | |
| Cash & restricted cash – beginning of period | 88,843 | 10,453 | |
| Cash & restricted cash – end of period | $ 85,985 | $ 14,448 | |
| Supplemental Disclosure of Cash Flow Information | |||
| Interest paid on debt | 892 | 285 | |
| Construction in progress included in accounts payable and accrued liabilities | 2,707 | — | |
| Noncash deferred financing cost accrual | — | 97 | |
| Noncash membership distribution accrual | 1,937 | 949 | |
| Warrant adjustment | 682 | — | |
| Noncash activity right-of-use assets adjustment | 430 | — | |
The accompanying notes are an integral part of these unaudited condensed consolidated financial statements.
Segments:
The following table details revenue, cost of revenues, and other operating costs for the Company’s reportable segments for three months ended March 31, 2026 and 2025, and reconciles to net loss on the consolidated statements of operations:
For the three months ended March 31, 2026
| Cryptocurrency
Mining |
Data Center Hosting | High- Performance Computing Services | Total | ||||
| Segment Revenue: Revenue from external customers | $ 2,169 | $ 6,688 | $ — | $ 8,857 | |||
| Reconciliation of revenue | |||||||
| Demand response service revenue (a) | 537 | ||||||
| Total consolidated revenue | 9,394 | ||||||
| Less: Segment cost of revenue | |||||||
| Utility costs | 1,132 | 1,792 | — | 2,924 | |||
| Wages, benefits, and employee related costs | 243 | 962 | — | 1,205 | |||
| Facilities and Equipment costs | 228 | 674 | — | 902 | |||
| Cost of revenue- depreciation | 1,011 | 1,191 | — | 2,202 | |||
| Other cost of revenue* | 119 | 508 | — | 627 | |||
| Total segment cost of revenue | 2,733 | 5,127 | — | 7,860 | |||
| General and administrative expenses | 44 | 462 | 506 | ||||
| Segment operating (loss) income | $ (608) | $ 1,099 | $ — | $ 491 |
For the three months ended March 31, 2025
| Cryptocurrency
Mining |
Data Center Hosting | High- Performance
Computing Services |
Total | ||||
| Segment Revenue: Revenue from external customers | $ 2,999 | 2,402 | $ 28 | $ 5,429 | |||
| Reconciliation of revenue | |||||||
| Demand response service revenue (a) | 507 | ||||||
| 5,936 | |||||||
| Less: Segment cost of revenue | |||||||
| Utility costs | 1,412 | 389 | — | 1,801 | |||
| Wages, benefits, and employee related costs | 219 | 470 | 7 | 696 | |||
| Facilities and Equipment costs | 207 | 365 | — | 572 | |||
| Cost of revenue- depreciation | 1,074 | 401 | — | 1,475 | |||
| Other cost of revenue* | 140 | 144 | — | 284 | |||
| Total segment cost of revenue | 3,052 | 1,769 | 7 | 4,828 | |||
| General and administrative expenses | 14 | 90 | 159 | 263 | |||
| Segment operating (loss) income | $ (67) | $ 543 | $ (138) | $ 338 |
- Demand response service revenue is included as a reconciling item of total revenue and not included as part of segment gross profit or loss.
- Other cost of revenue includes insurance, outside service costs and margins, and general costs.
The following table presents the reconciliation of segment operating income to net loss before taxes:
| For the three months ended March 31, | |||
| 2026 | 2025 | ||
| Segment operating income (loss) | $ 491 | $ 338 | |
| Reconciling Items: | |||
| Elimination of intercompany costs | 381 | 65 | |
| Other revenue (a) | 537 | 507 | |
| General and administrative, exclusive of depreciation and amortization (b) | (15,634) | (5,683) | |
| General and administrative, depreciation and amortization | (2,401) | (2,404) | |
| Interest expense | (1,481) | (838) | |
| Gain on debt extinguishment and revaluation, net | — | 551 | |
| Other financing expense | (564) | (201) | |
| Gain on sale of fixed assets | 32 | — | |
| Fair value adjustment loss | — | (118) | |
| Other income, net | 113 | 4 | |
| Net loss before taxes | $ (18,526) | $ (7,779) | |
- Demand response service revenue is included as a reconciling item of total revenue and not included as part of segment gross profit or loss.
- The reconciling general and administrative expense, exclusive of depreciation and amortization represent corporate and unallocated general and administrative expenses for the three months ended March 31, 2026 and 2025.
Gross Profit breakout:
The following table summarizes the balances for the project sites for cryptocurrency mining revenue, data hosting revenue, high-performance computing service revenue, demand response revenue, cost of cryptocurrency mining revenue, exclusive of depreciation, cost of data hosting revenue, exclusive of depreciation, cost of high-performance computing services, and cost of depreciation during the three months ended March 31, 2026:
| Soluna Digital | ||||||||||||||
| (Dollars in thousands) | Project
Dorothy 1B |
Project
Dorothy 1A |
Project
Dorothy 2 |
Project
Sophie |
Project Kati 1 | Other | Total | |||||||
| Cryptocurrency mining revenue | $ 2,169 | $ — | $ — | $ — | $ — | $ — | $ 2,169 | |||||||
| Data hosting revenue | 11 | 2,044 | 3,171 | 1,237 | 225 | — | 6,688 | |||||||
| Demand response services | 144 | 130 | 263 | — | — | — | 537 | |||||||
| Total revenue | 2,324 | 2,174 | 3,434 | 1,237 | 225 | — | 9,394 | |||||||
| Cost of cryptocurrency mining, exclusive of depreciation | 1,658 | — | — | — | — | — | 1,658 | |||||||
| Cost of data hosting revenue, exclusive of depreciation | 4 | 1,107 | 1,423 | 581 | 394 | 110 | 3,619 | |||||||
| Cost of cryptocurrency mining revenue- depreciation | 1,011 | — | — | — | — | — | 1,011 | |||||||
| Cost of data hosting revenue- depreciation | — | 288 | 606 | 204 | 93 | — | 1,191 | |||||||
| Total cost of revenue | 2,673 | 1,395 | 2,029 | 785 | 487 | 110 | 7,479 | |||||||
| Gross profit | $ (349) | $ 779 | $ 1,405 | $ 452 | $ (262) | $ (110) | $ 1,915 | |||||||
The following table summarizes the balances for the project sites for cryptocurrency mining revenue, data hosting revenue, high-performance computing service revenue, demand response revenue, cost of cryptocurrency mining revenue, exclusive of depreciation, cost of data hosting revenue, exclusive of depreciation, cost of high-performance computing services, and cost of depreciation during the three months ended March 31, 2025:
| Soluna Digital | Soluna Cloud | |||||||||||||
| (Dollars in thousands) | Project Dorothy 1B | Project Dorothy 1A | Project Sophie | Other | Soluna
Digital Subtotal |
Project
Ada |
Total | |||||||
| Cryptocurrency mining revenue | $ 2,999 | $ — | $ — | $ — | $ 2,999 | $ — | $ 2,999 | |||||||
| Data hosting revenue | — | 1,371 | 1,031 | — | 2,402 | — | 2,402 | |||||||
| Demand response services | 269 | 238 | — | — | 507 | — | 507 | |||||||
| High-performance computing services | — | — | — | — | — | 28 | 28 | |||||||
| Total revenue | 3,268 | 1,609 | 1,031 | — | 5,908 | 28 | 5,936 | |||||||
| Cost of cryptocurrency mining, exclusive of depreciation | 1,954 | — | — | — | 1,954 | — | 1,954 | |||||||
| Cost of data hosting revenue, exclusive of depreciation | — | 885 | 372 | 70 | 1,327 | — | 1,327 | |||||||
| Cost of high-performance computing service revenue | — | — | — | — | — | 7 | 7 | |||||||
| Cost of cryptocurrency mining revenue- depreciation | 1,074 | — | — | — | 1,074 | — | 1,074 | |||||||
| Cost of data hosting revenue- depreciation | — | 295 | 106 | — | 401 | — | 401 | |||||||
| Total cost of revenue | 3,028 | 1,180 | 478 | 70 | 4,756 | 7 | 4,763 | |||||||
| Gross (loss) profit | $ 240 | $ 429 | $ 553 | $ (70) | $ 1,152 | $ 21 | $ 1,173 | |||||||
EBITDA and Adjusted EBITDA Tables:
Reconciliations of EBITDA and Adjusted EBITDA to net loss, the most comparable GAAP financial metric, for historical periods are presented in the table below:
| (Dollars in thousands) | Three Months Ended March 31, |
|||
| 2026 | 2025 | |||
| Net loss | $ (17,902) | $ (7,354) | ||
| Interest expense | 1,481 | 838 | ||
| Income tax benefit | (624) | (425) | ||
| Depreciation and amortization | 4,603 | 3,879 | ||
| EBITDA | (12,442) | (3,062) | ||
| Adjustments: Non-cash items | ||||
| Stock-based compensation costs | 10,222 | 1,847 | ||
| Gain on sale of fixed assets | (32) | — | ||
| Right of first refusal amortization gain | (90) | — | ||
| SEPA commitment fee | 250 | — | ||
| Fair value adjustment loss | — | 118 | ||
| Gain on debt extinguishment and revaluation, net | — | (551) | ||
| Adjusted EBITDA | $ (2,092) | $ (1,648) | ||
The following table represents the Adjusted EBITDA activity between each three-month period from January 1, 2025 through December 31, 2025.
| (Dollars in thousands) | Three months ended March 31, 2025 |
Three months ended June 30, 2025 |
Three months ended September 30, 2025 |
Three months ended December 31, 2025 |
||||
| Net loss | $ (7,354) | $ (7,780) | $ (25,787) | $ (16,070) | ||||
| Interest expense, net | 838 | 1,196 | 1,212 | 1,589 | ||||
| Income tax benefit | (425) | (608) | (666) | (617) | ||||
| Depreciation and amortization | 3,879 | 3,989 | 4,119 | 4,358 | ||||
| EBITDA | (3,062) | (3,203) | (21,122) | (10,740) | ||||
| Adjustments: Non-cash items | ||||||||
| Stock-based compensation costs | 1,847 | 1,942 | 1,882 | 4,895 | ||||
| Loss on sale of fixed assets and credit on equipment deposits | — | 22 | 780 | 349 | ||||
| Fair value on placement agent warrant and financing fees | — | — | 146 | — | ||||
| Fair value adjustment loss | 118 | — | 22,047 | 1,516 | ||||
| Impairment on fixed assets | — | 12 | — | — | ||||
| Gain on debt extinguishment and revaluation, net | (551) | — | (10,107) | — | ||||
| Adjusted EBITDA | $ (1,648) | $ (1,227) | $ (6,374) | $ (3,980) |