Steady gross margin, continued improvement in Three Month Adjusted EBITDA of +$2.3 million since Q3 2024, and energized Dorothy 2
ALBANY, NY, August 15, 2025 – Soluna Holdings, Inc. (“Soluna” or the “Company”) (NASDAQ: SLNH), a developer of green data centers for intensive computing applications, including Bitcoin mining and AI, announced its financial results for the second quarter ended June 30, 2025.
“Second quarter results demonstrate continued Adjusted EBITDA improvement and margin strength in our operating sites. In Q2, we also welcomed our first customers into Project Dorothy 2, the expansion of our first major site in Texas. We rebuilt our capital raising toolkit, secured our first at-the-market offering issuance, and prepared for a successful equity offering in July. We expanded our partnership with Spring Lane Capital to help launch our next flagship data center, Project Kati. We are now focused on scale,” said John Belizaire, CEO of Soluna Holdings.
“We are pleased to report the fourth quarter in a row of Adjusted EBITDA growth, improving by 25.5% ($0.4M) in Q2 over the prior quarter amidst market softness in Hashprice, while maintaining a steady 19% gross margin,” said John Tunison, CFO of Soluna.
Q2 2025 Operational and Corporate Highlights:
- Project Kati Land Secured and Subsequently Closed $20M to Launch 35 MW Kati 1 – Soluna has secured land and $20M in funding from Spring Lane Capital to begin construction on Kati 1, the first 35 MW phase of our 166 MW wind-powered data center. Construction is expected to begin in Q3, with initial energization targeted for early 2026.
- Expanded Hosting Deployments with Key Customers – Increased deployments of existing partners Blockware, Compass Mining, and other Top-tier Miners, as Dorothy 1 space became available and Dorothy 2 came online, deepening relationships with some of the industry’s most established miners.
- Project Dorothy 2 Construction On Track – All three building phases progressing on schedule, with full energization anticipated in Q4.
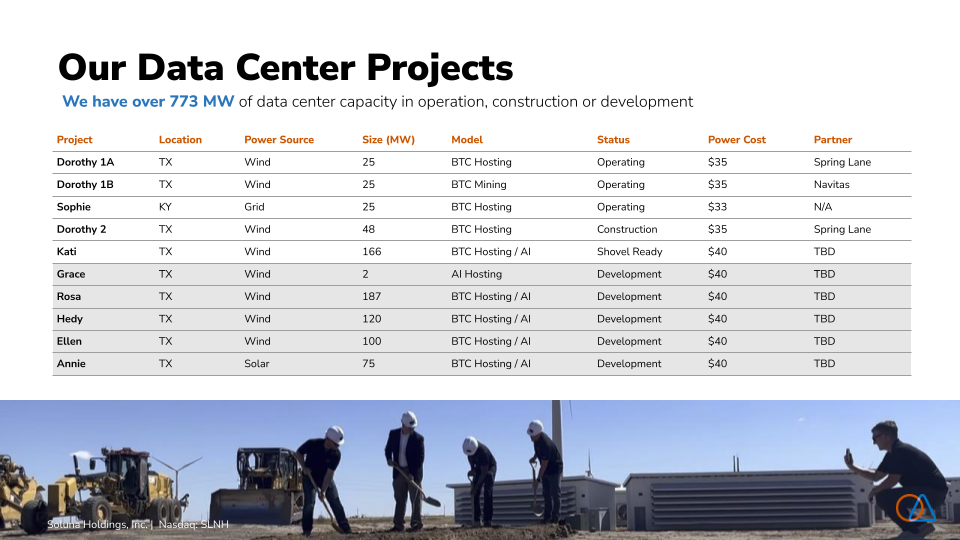
- 295 MW of New Projects Launched in Q2, Including Our First Solar-Powered Data Center – Including wind-powered Projects Hedy and Ellen, and solar-powered Project Annie. We believe these additions mark a major step in scaling Renewable Computing and diversifying our energy mix across Texas.
- Increased Power Pipeline to 2.8 GW of Long-Term Capacity – With 2.8 GW of long-term clean energy capacity in our pipeline, Soluna anticipates that it will be positioned to meet the rising demand for sustainable computing infrastructure at scale.
Second Quarter Finance and Operations Highlights:
- Net loss for the three months declined Q2 2024 to Q2 2025 by ($1.4 million) – driven by the above-mentioned Revenue, Gross Profit and SG&A drivers with a $2.9 million increase in Operating Loss, increased by $1.3 million combined higher Interest, Tax and Other Expenses which include consent fees to Preferred B holder and Kati wind farm loss generation fee offset by the prior year loss on convertible debt and warrant revaluation for $5.6 million.
- Adjusted EBITDA improved $0.4 million from Q1 2025 to Q2 2025, primarily driven by a steady 19% gross margin, controlling expenses, and no significant interconnection outages. This resilient progress was despite headwinds from average Hashprice declining by 5% to $51, dampening profit sharing.
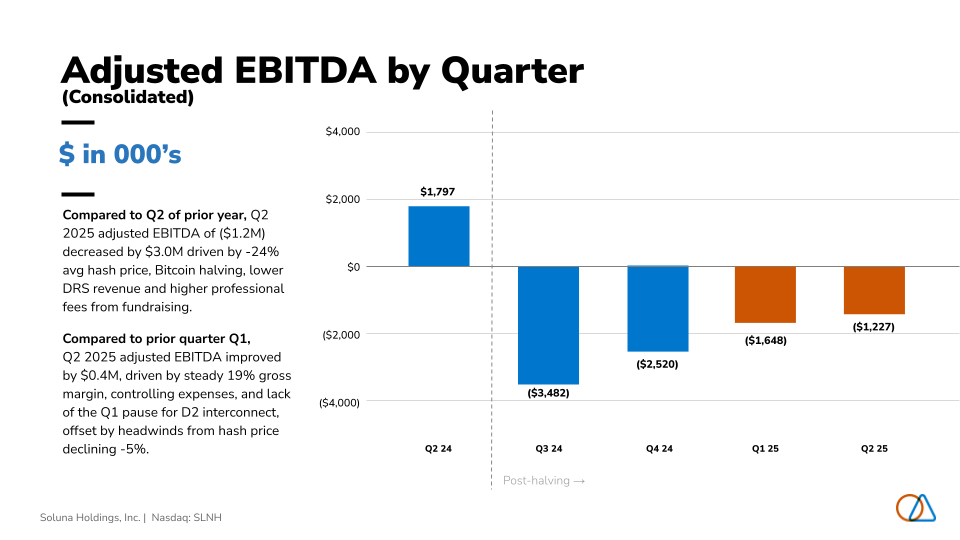
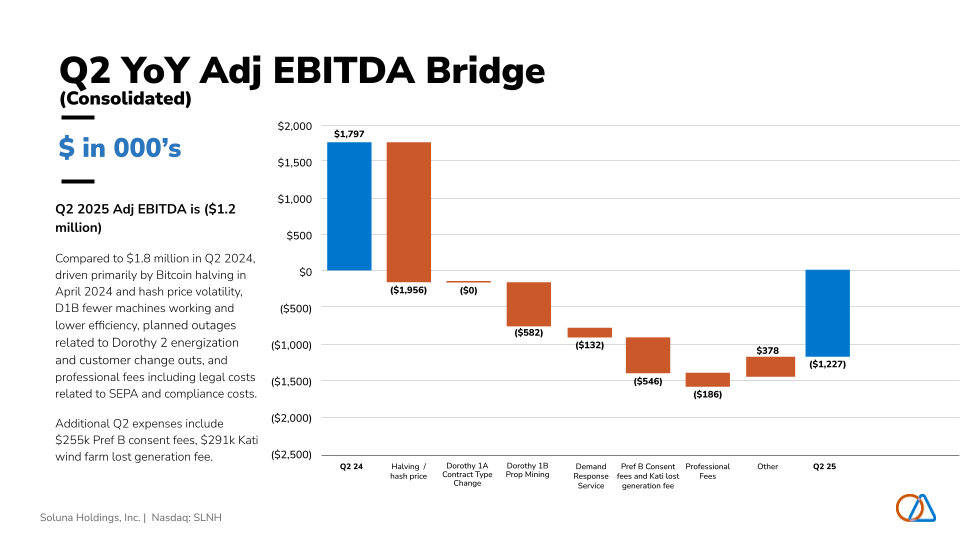
- Adjusted EBITDA declined ($3.0 million) from Q2 2024 to Q2 2025, driven primarily by Bitcoin halving in April 2024 and Hashprice volatility ($0.6M) from fewer machines online and efficiency at Dorothy 1B. Professional fees were higher ($0.2M), including legal costs related to the Standby Equity Purchase Agreement and compliance costs.
In connection with our successful ATM raise and related fundraising, we incurred ($255) thousand of consent fees paid to the Series B Preferred stockholder. As part of securing land for Project Kati, we incurred ($291) thousand fees for lost power generation on the wind farm.
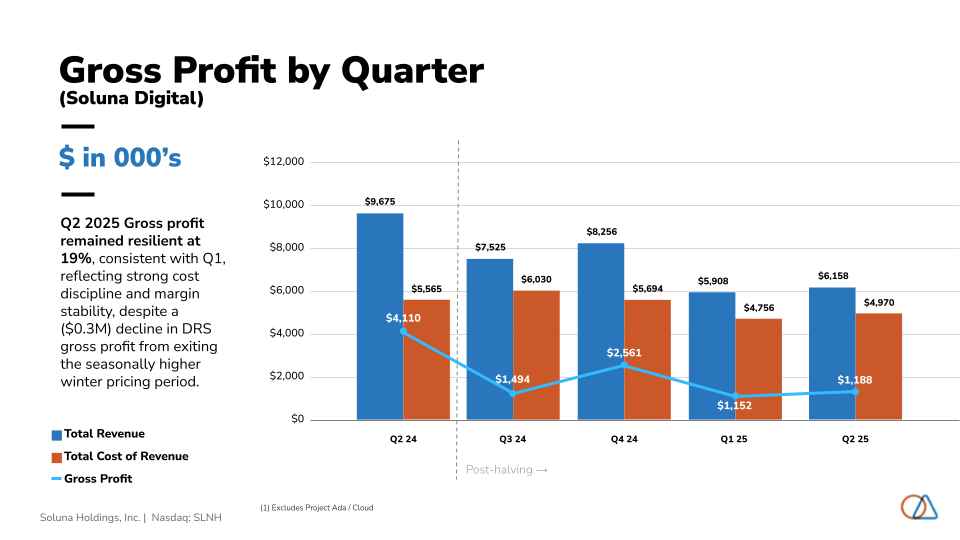
- Gross profit for our operating sites in Soluna Digital remained steady compared to the prior quarter Q1 2025, Q2 2025 reported strong cost discipline and gross margin stability, despite a ($0.3M) decline in Demand Response Service gross profit from exiting the seasonally higher winter pricing period.
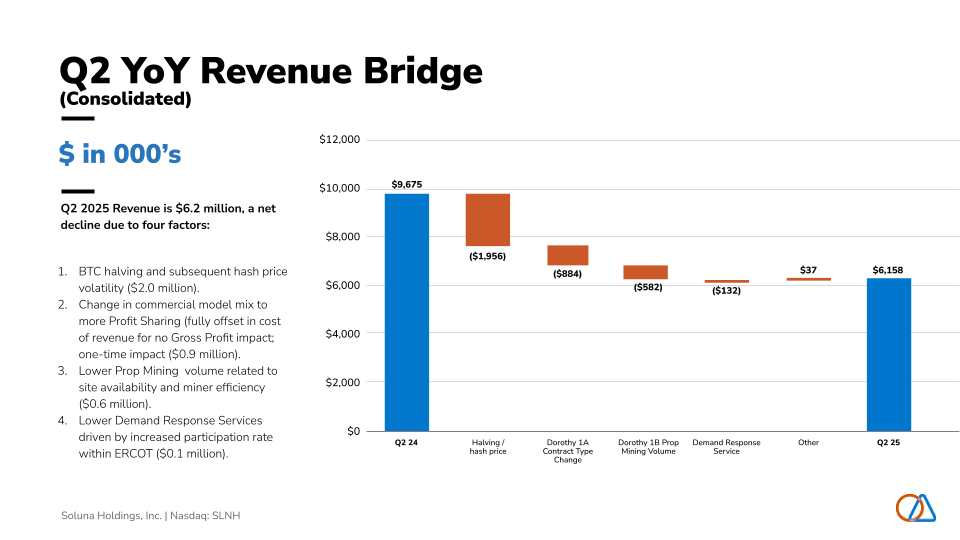
- Revenue for Q2 2025 is $6.2 million, a Net Decline of $3.5 million for the three months Year-over-year. Four factors drove the decrease. Bitcoin halving and subsequent Hashprice volatility ($2.0 million), the change in commercial model mix to more Profit Sharing (fully offset by decline in cost of revenue by ($0.8 million) for no Gross Profit impact), lower Prop Mining volume related to site availability and miner efficiency ($0.6 million), and lower Demand Response Services driven by increased participation rate within ERCOT ($0.1 million).
- Revenue Generation Poised for Growth – We expect Revenue to stabilize and grow as we continue to commission additional MW of Bitcoin Hosting capacity over the next two years, related to Dorothy 2 and Kati 1, as illustrated in the recently published 2025 Earnings Power Presentation.
- Robust Cash Reserves – Quarter-end unrestricted cash was $9.9 million, a $2.0 million rise since December 31, 2024.
- General and administrative expenses were flat year-over-year and improved from the prior quarter. Strong cost discipline has enabled these costs to be contained even as site development continues to grow substantially.
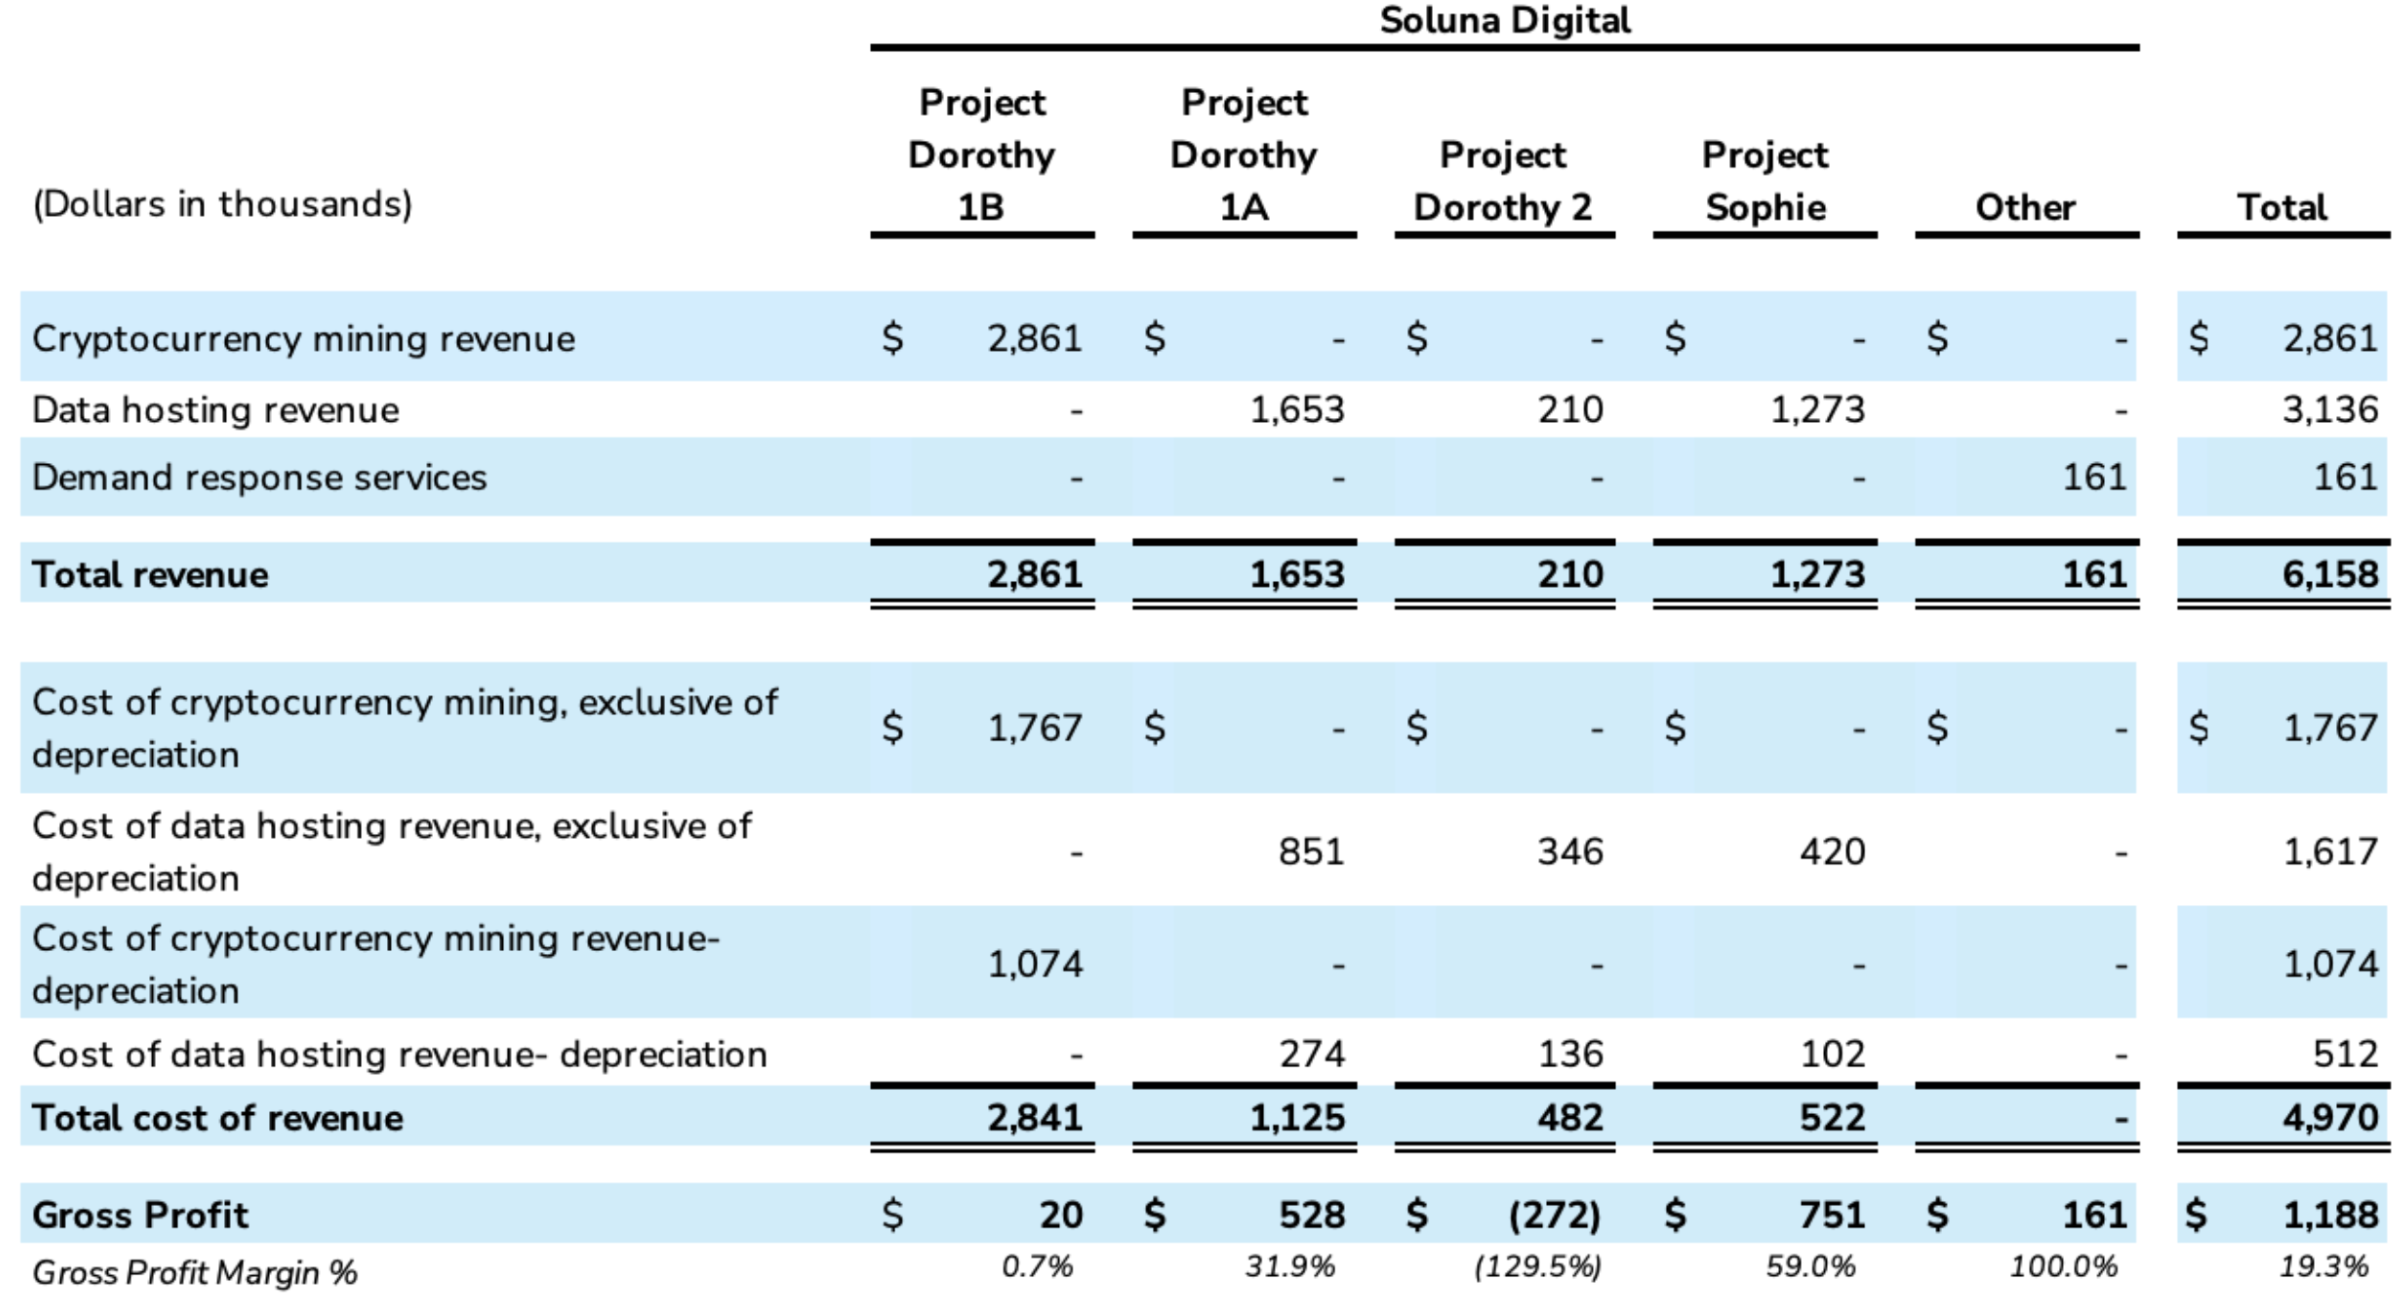
Q2 2025 Revenue & Cost of Revenue by Project Site
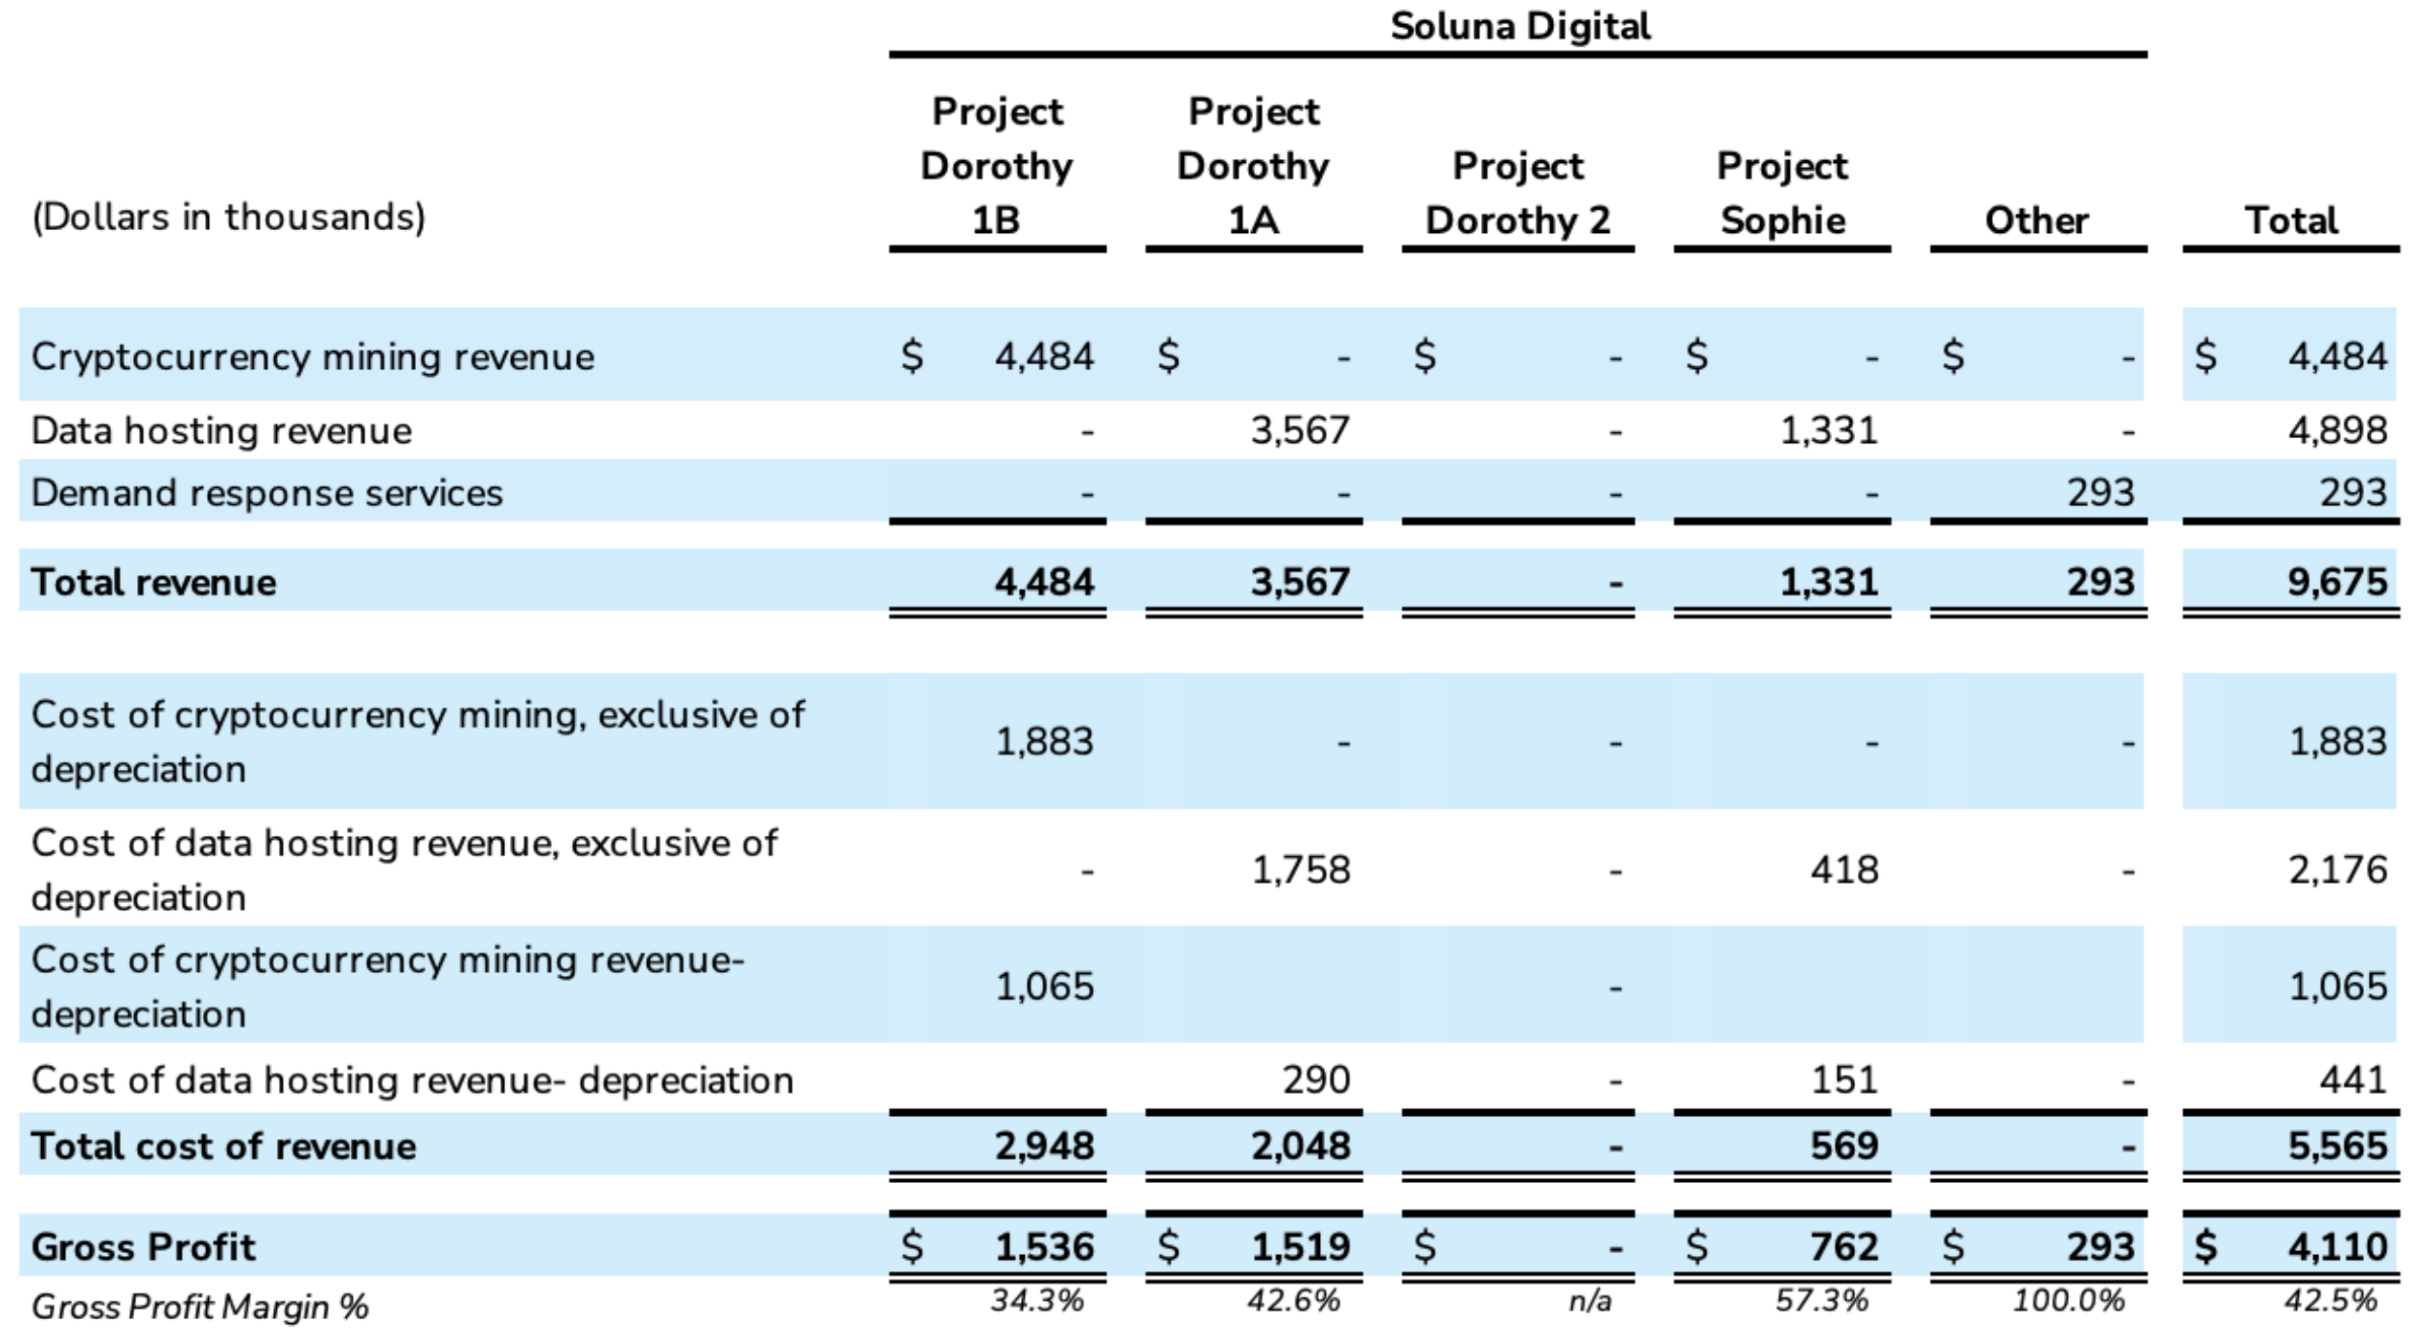
Q2 2024 Revenue & Cost of Revenue by Project Site
The audited financial statements and Annual Report on Form 10-K for the year ended December 31, 2024, filed with the U.S. Securities and Exchange Commission (“SEC”) on March 31, 2025, are available online.
Our current Investor Presentation can be found here.
Our 2025 Earnings Power Presentation can be found here.
Soluna’s glossary of terms can be found here.
Safe Harbor Statement
This announcement contains forward-looking statements. These statements are made under the “safe harbor” provisions of the U.S. Private Securities Litigation Reform Act of 1995. These forward-looking statements can be identified by terminology such as “will,” “expects,” “anticipates,” “future,” “intends,” “plans,” “believes,” “estimates,” “confident” and similar statements. Other examples of forward-looking statements may include, but are not limited to, (i) statements of Company plans and objectives, including the completion of Projects Kati 1, Dorothy 2, Hedy, Ellen, and Annie, and the closing of the land purchase for Project Kati, (ii) statements of future economic performance, and (iii) statements of assumptions underlying other statements about the Company or its business. Soluna may also make written or oral forward-looking statements in its periodic reports to the SEC , in its annual report to shareholders, in press releases and other written materials and in oral statements made by its officers, directors or employees to third parties. Statements that are not historical facts, including but not limited to statements about Soluna’s beliefs and expectations, are forward-looking statements. Forward-looking statements involve inherent risks and uncertainties, further information regarding which is included in the Company’s filings with the SEC. All information provided in this press release is as of the date of the press release, and Soluna undertakes no duty to update such information, except as required under applicable law.
Non-GAAP Measures
In addition to figures prepared in accordance with generally accepted accounting principles (“GAAP”), Soluna from time to time may present alternative non-GAAP performance measures, e.g., EBITDA, adjusted EBITDA, adjusted net profit/loss, adjusted earnings per share, free cash flow, both on a company basis and on a project-level basis, among others. EBITDA is defined as earnings before interest, taxes, and depreciation and amortization. Adjusted EBITDA is defined as EBITDA adjusted for stock-based compensation costs, provision for credit losses, loss on sale of fixed assets, impairment on fixed assets, fair value adjustment on Standby Equity Purchase Agreement draws, and loss (gain) on debt extinguishment and revaluation, net. Project-level measures may not take into account a full allocation of corporate expenses. These measures should be considered in addition to, but not as a substitute for, the information prepared in accordance with GAAP. Alternative performance measures are not subject to GAAP or any other generally accepted accounting principles. Other companies may define these terms in different ways. See our annual report on Form 10-K for the year ended December 31, 2024, for an explanation of how management uses these measures in evaluating its operations. Investors should review the non-GAAP reconciliations provided below and not rely on any single financial measure to evaluate the Company’s business.
About Soluna Holdings, Inc. (Nasdaq: SLNH)
Soluna is on a mission to make renewable energy a global superpower using computing as a catalyst. The company designs, develops, and operates digital infrastructure that transforms surplus renewable energy into global computing resources. Soluna’s pioneering data centers are strategically co-located with wind, solar, or hydroelectric power plants to support high-performance computing applications, including Bitcoin Mining, Generative AI, and other compute-intensive applications. Soluna’s proprietary software MaestroOS(™) helps energize a greener grid while delivering cost-effective and sustainable computing solutions and superior returns. To learn more, visit solunacomputing.com and follow us on:
LinkedIn: https://www.linkedin.com/company/solunaholdings/
X (formerly Twitter): x.com/solunaholdings
YouTube: youtube.com/c/solunacomputing
Newsletter: bit.ly/solunasubscribe
Resource Center: solunacomputing.com/resources
Soluna regularly posts important information on its website and encourages investors and potential investors to consult the Soluna investor relations and investor resources sections of its website regularly.
Contact Information
John Tunison
Chief Financial Officer
Soluna Holdings, Inc.
Soluna Holdings, Inc. and Subsidiaries
Condensed Consolidated Balance Sheets
As of June 30, 2025 (Unaudited) and December 31, 2024
| (Dollars in thousands, except per share) | June 30, 2025 | December 31, 2024 | ||||
| Assets | ||||||
| Current Assets: | ||||||
| Cash | $ | 9,878 | $ | 7,843 | ||
| Restricted cash | 2,215 | 1,150 | ||||
| Accounts receivable, net (allowance for expected credit losses of $244 at June 30, 2025 and December 31, 2024) | 2,649 | 2,693 | ||||
| Prepaid expenses and other current assets | 2,236 | 1,781 | ||||
| Equipment held for sale | – | 28 | ||||
| Total Current Assets | 16,978 | 13,495 | ||||
| Restricted cash, noncurrent | 3,060 | 1,460 | ||||
| Other assets | 1,107 | 2,724 | ||||
| Deposits and credits on equipment | 1,046 | 5,145 | ||||
| Property, plant and equipment, net | 56,521 | 47,283 | ||||
| Intangible assets, net | 12,957 | 17,620 | ||||
| Operating lease right-of-use assets | 283 | 313 | ||||
| Total Assets | $ | 91,952 | $ | 88,040 | ||
| Liabilities and Stockholders’ Equity | ||||||
| Current Liabilities: | ||||||
| Accounts payable | $ | 3,942 | $ | 2,840 | ||
| Accrued liabilities | 5,934 | 6,785 | ||||
| Accrued interest payable | 3,286 | 2,275 | ||||
| Contract liability | 19,348 | 20,015 | ||||
| Current portion of debt | 13,255 | 14,444 | ||||
| Income tax payable | 62 | 37 | ||||
| Customer deposits | 1,962 | 1,416 | ||||
| Operating lease liability | 63 | 61 | ||||
| Total Current Liabilities | 47,852 | 47,873 | ||||
| Other liabilities | 333 | 235 | ||||
| Long-term debt | 10,021 | 7,061 | ||||
| Operating lease liability | 220 | 252 | ||||
| Deferred tax liability, net | 4,207 | 5,257 | ||||
| Total Liabilities | 62,633 | 60,678 | ||||
| Commitments and Contingencies (Note 10) | ||||||
| Stockholders’ Equity: | ||||||
| 9.0% Series A Cumulative Perpetual Preferred Stock, par value $0.001 per share, $25.00 liquidation preference; authorized 6,040,000; 4,953,545 shares issued and outstanding as of June 30, 2025 and December 31, 2024 | 5 | 5 | ||||
| Series B Preferred Stock, par value $0.0001 per share, authorized 187,500; 62,500 shares issued and outstanding as of June 30, 2025 and December 31, 2024 | — | — | ||||
| Common stock, par value $0.001 per share, authorized 75,000,000; 19,095,863 shares issued and 19,055,122 shares outstanding as of June 30, 2025 and 10,647,761 shares issued and 10,607,020 shares outstanding as of December 31, 2024 | 19 | 11 | ||||
| Additional paid-in capital | 323,557 | 315,607 | ||||
| Accumulated deficit | (329,242) | (314,304) | ||||
| Common stock in treasury, at cost, 40,741 shares at June 30, 2025 and December 31, 2024 | (13,798) | (13,798) | ||||
| Total Soluna Holdings, Inc. Stockholders’ (Deficit) Equity | (19,459) | (12,479) | ||||
| Non-Controlling Interest | 48,778 | 39,841 | ||||
| Total Stockholders’ Equity | 29,319 | 27,362 | ||||
| Total Liabilities and Stockholders’ Equity | $ | 91,952 | $ | 88,040 | ||
The accompanying notes are an integral part of these unaudited condensed consolidated financial statements.
Soluna Holdings, Inc. and Subsidiaries
Condensed Consolidated Statements of Operations (Unaudited)
For the Three and Six Months Ended June 30, 2025 and 2024
| (Dollars in thousands, except per share) | Three Months Ended | Six Months Ended | ||||||||||
| June 30, | June 30, | |||||||||||
| 2025 | 2024 | 2025 | 2024 | |||||||||
| Cryptocurrency mining revenue | $ | 2,861 | $ | 4,484 | $ | 5,860 | $ | 10,880 | ||||
| Data hosting revenue | 3,136 | 4,898 | 5,538 | 10,176 | ||||||||
| Demand response service revenue | 161 | 293 | 668 | 1,168 | ||||||||
| High-performance computing service revenue | – | – | 28 | – | ||||||||
| Total revenue | 6,158 | 9,675 | 12,094 | 22,224 | ||||||||
| Operating costs: | ||||||||||||
| Cost of cryptocurrency mining revenue, exclusive of depreciation | 1,767 | 1,883 | 3,721 | 3,724 | ||||||||
| Cost of data hosting revenue, exclusive of depreciation | 1,617 | 2,176 | 2,945 | 4,427 | ||||||||
| Cost of high-performance computing services | – | – | 7 | – | ||||||||
| Cost of cryptocurrency mining revenue- depreciation | 1,074 | 1,065 | 2,147 | 2,152 | ||||||||
| Cost of data hosting revenue- depreciation | 512 | 441 | 913 | 877 | ||||||||
| Total costs of revenue | 4,970 | 5,565 | 9,733 | 11,180 | ||||||||
| Operating expenses: | ||||||||||||
| General and administrative expenses, exclusive of depreciation and amortization | 5,397 | 5,382 | 11,344 | 9,378 | ||||||||
| Depreciation and amortization associated with general and administrative expenses | 2,403 | 2,403 | 4,807 | 4,805 | ||||||||
| Total general and administrative expenses | 7,800 | 7,785 | 16,151 | 14,183 | ||||||||
| Impairment on fixed assets | 12 | – | 12 | 130 | ||||||||
| Operating loss | (6,624) | (3,675) | (13,802) | (3,269) | ||||||||
| Interest expense | (1,196) | (449) | (2,034) | (873) | ||||||||
| (Loss) gain on debt extinguishment and revaluation, net | – | (5,600) | 551 | (8,698) | ||||||||
| Loss on sale of fixed assets | (22) | (21) | (22) | (21) | ||||||||
| Other expense, net | (546) | (49) | (860) | (25) | ||||||||
| Loss before income taxes | (8,388) | (9,794) | (16,167) | (12,886) | ||||||||
| Income tax benefit, net | 608 | 649 | 1,033 | 1,197 | ||||||||
| Net loss | (7,780) | (9,145) | (15,134) | (11,689) | ||||||||
| (Less) Net (loss) income attributable to non-controlling interest | (398) | 1,728 | (196) | 4,438 | ||||||||
| Net loss attributable to Soluna Holdings, Inc. | $ | (7,382) | $ | (10,873) | $ | (14,938) | $ | (16,127) | ||||
| Basic and Diluted loss per common share: | ||||||||||||
| Basic & Diluted loss per share | $ | (0.69) | $ | (2.97) | $ | (1.55) | $ | (5.68) | ||||
| Weighted average shares outstanding (Basic and Diluted) | 14,991,125 | 4,563,696 | 13,473,983 | 3,683,558 | ||||||||
The accompanying notes are an integral part of these unaudited condensed consolidated financial statements.
Soluna Holdings, Inc. and Subsidiaries
Condensed Consolidated Statements of Cash Flows (Unaudited)
For the Six Months Ended June 30, 2025 and 2024
| Six Months Ended June 30, | ||||||
| (Dollars in thousands) | 2025 | 2024 | ||||
| Operating Activities | ||||||
| Net loss | $ | (15,134) | $ | (11,689) | ||
| Adjustments to reconcile net loss to net cash used in operating activities: | ||||||
| Depreciation expense | 3,121 | 3,091 | ||||
| Amortization expense | 4,746 | 4,743 | ||||
| Stock-based compensation | 3,789 | 2,029 | ||||
| Deferred income taxes | (1,051) | (1,259) | ||||
| Impairment on fixed assets | 12 | 130 | ||||
| Provision for credit losses | – | 244 | ||||
| Amortization of operating lease asset | 30 | 122 | ||||
| (Gain) loss on debt extinguishment and revaluation, net | (551) | 8,698 | ||||
| Amortization of deferred financing costs and discount on notes | 338 | 59 | ||||
| SEPA fair value revaluation | 118 | – | ||||
| Loss on sale of fixed assets | 22 | 21 | ||||
| Changes in operating assets and liabilities: | ||||||
| Accounts receivable | 44 | (486) | ||||
| Prepaid expenses and other current assets | (455) | (10,767) | ||||
| Other long-term assets | 1,607 | 1 | ||||
| Accounts payable | 1,102 | 353 | ||||
| Contract liability | (667) | – | ||||
| Operating lease liabilities | (30) | (123) | ||||
| Other liabilities and customer deposits | 644 | (404) | ||||
| Accrued liabilities and interest payable | 1,042 | 1,764 | ||||
| Net cash used in operating activities | (1,273) | (3,473) | ||||
| Investing Activities | ||||||
| Purchases of property, plant and equipment | (12,365) | (278) | ||||
| Purchases of intangible assets | (83) | (64) | ||||
| Proceeds from sale of property, plant and equipment | – | 215 | ||||
| Deposits on equipment, net | 4,099 | (2,096) | ||||
| Net cash used in investing activities | (8,349) | (2,223) | ||||
| Financing Activities | ||||||
| Proceeds from common stock warrant exercises | – | 2,304 | ||||
| Proceeds from sale of common stock on SEPA | 2,005 | – | ||||
| Proceeds from notes | 5,269 | 13,220 | ||||
| Proceeds from sale of common stock on ATM | 2,178 | – | ||||
| Payments on notes and deferred financing costs | (3,275) | (1,910) | ||||
| Payments on ATM | (132) | – | ||||
| Contributions from non-controlling interest | 11,852 | – | ||||
| Distributions to non-controlling interest | (3,575) | (5,776) | ||||
| Net cash provided by financing activities | 14,322 | 7,838 | ||||
| Increase in cash & restricted cash | 4,700 | 2,142 | ||||
| Cash & restricted cash – beginning of period | 10,453 | 10,367 | ||||
| Cash & restricted cash – end of period | $ | 15,153 | $ | 12,509 | ||
| Supplemental Disclosure of Cash Flow Information | ||||||
| Interest paid on debt | 685 | 203 | ||||
| Warrant consideration in relation to convertible notes and revaluation of warrant liability | – | 7,648 | ||||
| Notes converted to common stock | – | 3,712 | ||||
| Noncash membership distribution accrual | 323 | 456 | ||||
| Warrant consideration in relation to Soluna Cloud | – | 314 | ||||
| Fair value consideration for Green Cloud issuance of shares | 810 | – | ||||
The accompanying notes are an integral part of these unaudited condensed consolidated financial statements.
Segment Information
The following table details revenue, cost of revenues, and other operating costs for the Company’s reportable segments for three months ended June 30, 2025 and 2024, and reconciles to net income (loss) on the consolidated statements of operations:
For the three months ended June 30, 2025
| Cryptocurrency Mining |
Data Center Hosting |
High- Performance Computing Services |
Total | |||||||||||
| Segment Revenue: Revenue from external customers | $ | 2,861 | $ | 3,136 | $ | – | $ | 5,997 | ||||||
| Reconciliation of revenue | ||||||||||||||
| Demand response revenue (a) | 161 | |||||||||||||
| Total consolidated revenue | 6,158 | |||||||||||||
| Less: Segment cost of revenue | ||||||||||||||
| Utility costs | 1,278 | 471 | – | 1,749 | ||||||||||
| Wages, benefits, and employee related costs | 203 | 531 | – | 734 | ||||||||||
| Facilities and Equipment costs | 250 | 521 | – | 771 | ||||||||||
| Cost of revenue- depreciation | 1,074 | 512 | – | 1,586 | ||||||||||
| Other cost of revenue* | 148 | 364 | – | 512 | ||||||||||
| Total segment cost of revenue | 2,953 | 2,399 | – | 5,352 | ||||||||||
| General and administrative expenses | 40 | 94 | 110 | 244 | ||||||||||
| Impairment on fixed assets | – | 12 | – | 12 | ||||||||||
| Segment operating income (loss) | $ | (132) | $ | 631 | $ | (110) | $ | 389 | ||||||
For the three months ended June 30, 2024
| Cryptocurrency Mining |
Data Center Hosting |
High- Performance Computing Services |
Total | ||||||||||||
| Segment Revenue: Revenue from external customers | $ | 4,484 | $ | 4,898 | $ | – | $ | 9,382 | |||||||
| Reconciliation of revenue | |||||||||||||||
| Demand response revenue (a) | – | 293 | |||||||||||||
| 9,675 | |||||||||||||||
| Less: Segment cost of revenue | |||||||||||||||
| Utility costs | 1,322 | 1,363 | – | 2,685 | |||||||||||
| Wages, benefits, and employee related costs | 190 | 468 | – | 658 | |||||||||||
| Facilities and Equipment costs | 336 | 323 | – | 659 | |||||||||||
| Cost of revenue- depreciation | 1,065 | 441 | – | 1,506 | |||||||||||
| Other cost of revenue* | 127 | 92 | – | 219 | |||||||||||
| Total segment cost of revenue | 3,040 | 2,687 | – | 5,727 | |||||||||||
| General and administrative expenses | 106 | 146 | 58 | 310 | |||||||||||
| Impairment on fixed assets | – | – | – | – | |||||||||||
| Segment operating income | $ | 1,338 | $ | 2,065 | $ | (58) | $ | 3,345 | |||||||
| (a) | Demand response service revenue is included as a reconciling item of total revenue and not included as part of segment gross profit or loss. |
| * | Other cost of revenue includes insurance, outside service costs and margins, and general costs. |
The following table presents the reconciliation of segment operating income (loss) to net income (loss) before taxes:
| For the three months ended June 30, | ||||||
| 2025 | 2024 | |||||
| Segment operating income | $ | 389 | $ | 3,345 | ||
| Reconciling Items: | ||||||
| Elimination of intercompany costs | 381 | 162 | ||||
| Other revenue (a) | 161 | 293 | ||||
| General and administrative, exclusive of depreciation and amortization (b) | (5,152) | (5,072) | ||||
| General and administrative, depreciation and amortization | (2,403) | (2,403) | ||||
| Interest expense | (1,196) | (449) | ||||
| Loss on debt extinguishment and revaluation, net | – | (5,600) | ||||
| Loss on sale of fixed assets | (22) | (21) | ||||
| Other expense, net | (546) | (49) | ||||
| Net loss before taxes | $ | (8,388) | $ | (9,794) | ||
| (a) | Demand response service revenue is included as a reconciling item of total revenue and not included as part of segment gross profit or loss |
| (b) | The reconciling general and administrative expense, exclusive of depreciation and amortization represent corporate and unallocated general and administrative expenses for the three months ended June 30, 2025 and 2024. |
The following table details revenue, cost of revenues, and other operating costs for the Company’s reportable segments for six months ended June 30, 2025 and 2024, and reconciles to net income (loss) on the consolidated statements of operations.
For the six months ended June 30, 2025
| Cryptocurrency
Mining |
Data Center Hosting |
High- Performance Computing Services |
Total | |||||||||||
| Segment Revenue: Revenue from external customers | $ | 5,860 | $ | 5,538 | $ | 28 | $ | 11,426 | ||||||
| Reconciliation of revenue | ||||||||||||||
| Demand response revenue (a) | 668 | |||||||||||||
| Total consolidated revenue | 12,094 | |||||||||||||
| Less: Segment cost of revenue | ||||||||||||||
| Utility costs | 2,690 | 861 | – | 3,551 | ||||||||||
| Wages, benefits, and employee related costs | 421 | 1,001 | 7 | 1,429 | ||||||||||
| Facilities and Equipment costs | 457 | 886 | – | 1,343 | ||||||||||
| Cost of revenue- depreciation |
2,147 | 913 | – | 3,060 | ||||||||||
| Other cost of revenue* | 288 | 508 | – | 796 | ||||||||||
| Total segment cost of revenue | 6,003 | 4,169 | 7 | 10,179 | ||||||||||
| General and administrative expenses | 55 | 175 | 269 | 499 | ||||||||||
| Impairment on fixed assets | – | 12 | – | 12 | ||||||||||
| Segment operating income (loss) | $ | (198) | $ | 1,182 | $ | (248) | $ | 736 | ||||||
For the six months ended June 30, 2024
| Cryptocurrency Mining |
Data Center Hosting |
High- Performance Computing Services |
Total | ||||||||||||
| Segment Revenue: Revenue from external customers | $ | 10,880 | $ | 10,176 | $ | – | $ | 21,056 | |||||||
| Reconciliation of revenue | |||||||||||||||
| Demand response revenue (a) | – | 1,168 | |||||||||||||
| 22,224 | |||||||||||||||
| Less: Segment cost of revenue | |||||||||||||||
| Utility costs | 2,699 | 2,720 | – | 5,419 | |||||||||||
| Wages, benefits, and employee related costs | 381 | 927 | – | 1,308 | |||||||||||
| Facilities and Equipment costs | 511 | 622 | – | 1,133 | |||||||||||
| Cost of revenue- depreciation | 2,152 | 877 | – | 3,029 | |||||||||||
| Other cost of revenue* | 304 | 309 | – | 613 | |||||||||||
| Total segment cost of revenue | 6,047 | 5,455 | – | 11,502 | |||||||||||
| General and administrative expenses | 107 | 153 | 58 | 318 | |||||||||||
| Impairment on fixed assets | 130 | – | – | 130 | |||||||||||
| Segment operating income (loss) | $ | 4,596 | $ | 4,568 | $ | (58) | $ | 9,106 | |||||||
| (a) | Demand response service revenue is included as a reconciling item of total revenue and not included as part of segment gross profit or loss. |
| * | Other cost of revenue includes insurance, outside service costs and margins, and general costs. |
The following table presents the reconciliation of segment operating income (loss) to net income (loss) before taxes:
| For the six months ended June 30, | ||||||
| 2025 | 2024 | |||||
| Segment operating income | $ | 736 | $ | 9,106 | ||
| Reconciling Items: | ||||||
| Elimination of intercompany costs | 446 | 322 | ||||
| Other revenue (a) | 668 | 1,168 | ||||
| General and administrative, exclusive of depreciation and amortization (b) | (10,845) | (9,060) | ||||
| General and administrative, depreciation and amortization | (4,807) | (4,805) | ||||
| Interest expense | (2,034) | (873) | ||||
| Gain (loss) on debt extinguishment and revaluation, net | 551 | (8,698) | ||||
| Loss on sale of fixed assets | (22) | (21) | ||||
| Other expense, net | (860) | (25) | ||||
| Net loss before taxes | $ | (16,167) | $ | (12,886) | ||
| (a) | Demand response service revenue is included as a reconciling item of total revenue and not included as part of segment gross profit or loss |
| (b) | The reconciling general and administrative expense, exclusive of depreciation and amortization represent corporate and unallocated general and administrative expenses for the six months ended June 30, 2025 and 2024. |
Gross Profit Breakout:
The following table summarizes the balances for the project sites for cryptocurrency mining revenue, data hosting revenue, high-performance computing service revenue, demand response revenue, cost of cryptocurrency mining revenue, exclusive of depreciation, cost of data hosting revenue, exclusive of depreciation, cost of high-performance computing services, and cost of depreciation during the three months ended June 30, 2025:
| Soluna Digital | |||||||||||||||||||||||
| (Dollars in thousands) | Project Dorothy 1B |
Project Dorothy 1A |
Project Dorothy 2 |
Project Sophie |
Other | Total | |||||||||||||||||
| Cryptocurrency mining revenue | $ | 2,861 | $ | – | $ | – | $ | – | $ | – | $ | 2,861 | |||||||||||
| Data hosting revenue | – | 1,653 | 210 | 1,273 | – | 3,136 | |||||||||||||||||
| Demand response services | – | – | – | – | 161 | 161 | |||||||||||||||||
| Total revenue | 2,861 | 1,653 | 210 | 1,273 | 161 | 6,158 | |||||||||||||||||
| Cost of cryptocurrency mining, exclusive of depreciation | 1,767 | – | – | – | – | 1,767 | |||||||||||||||||
| Cost of data hosting revenue, exclusive of depreciation | – | 851 | 346 | 420 | – | 1,617 | |||||||||||||||||
| Cost of high-performance computing service revenue | – | – | – | – | – | – | |||||||||||||||||
| Cost of cryptocurrency mining revenue- depreciation | 1,074 | – | – | – | – | 1,074 | |||||||||||||||||
| Cost of data hosting revenue- depreciation | – | 274 | 136 | 102 | – | 512 | |||||||||||||||||
| Total cost of revenue | 2,841 | 1,125 | 482 | 522 | – | 4,970 | |||||||||||||||||
| Gross profit (loss) | $ | 20 | $ | 528 | $ | (272) | $ | 751 | $ | 161 | $ | 1,188 | |||||||||||
The following table summarizes the balances for the project sites for cryptocurrency mining revenue, data hosting revenue, high-performance computing service revenue, demand response revenue, cost of cryptocurrency mining revenue, exclusive of depreciation, cost of data hosting revenue, exclusive of depreciation, cost of high-performance computing services, and cost of depreciation during the three months ended June 30, 2024:
| Soluna Digital | ||||||||||||||||||||
| (Dollars in thousands) | Project Dorothy 1B |
Project Dorothy 1A |
Project Sophie |
Other | Total | |||||||||||||||
| Cryptocurrency mining revenue | $ | 4,484 | $ | – | $ | – | $ | – | $ | 4,484 | ||||||||||
| Data hosting revenue | – | 3,567 | 1,331 | – | 4,898 | |||||||||||||||
| Demand response services | – | – | – | 293 | 293 | |||||||||||||||
| High-performance computing services | – | – | – | – | – | |||||||||||||||
| Total revenue | 4,484 | 3,567 | 1,331 | 293 | 9,675 | |||||||||||||||
| Cost of cryptocurrency mining, exclusive of depreciation | 1,883 | – | – | – | 1,883 | |||||||||||||||
| Cost of data hosting revenue, exclusive of depreciation | – | 1,758 | 418 | – | 2,176 | |||||||||||||||
| Cost of high-performance computing service revenue | – | – | – | – | – | |||||||||||||||
| Cost of cryptocurrency mining revenue- depreciation | 1,065 | – | – | – | 1,065 | |||||||||||||||
| Cost of data hosting revenue- depreciation | – | 290 | 151 | – | 441 | |||||||||||||||
| Total cost of revenue | 2,948 | 2,048 | 569 | – | 5,565 | |||||||||||||||
| Gross profit | $ | 1,536 | $ | 1,519 | $ | 762 | $ | 293 | $ | 4,110 | ||||||||||
The following table summarizes the balances for the project sites for cryptocurrency mining revenue, data hosting revenue, high-performance computing service revenue, demand response revenue, cost of cryptocurrency mining revenue, exclusive of depreciation, cost of data hosting revenue, exclusive of depreciation, cost of high-performance computing services, and cost of depreciation during the six months ended June 30, 2025:
| Soluna Digital | Soluna Cloud | |||||||||||||||||||||||||||
| (Dollars in thousands) | Project Dorothy 1B | Project Dorothy 1A | Project Dorothy 2 | Project Sophie | Other | Soluna Digital Subtotal | Project Ada |
Total | ||||||||||||||||||||
| Cryptocurrency mining revenue | $ | 5,860 | $ | – | $ | – | $ | – | $ | – | $ | 5,860 | $ | – | $ | 5,860 | ||||||||||||
| Data hosting revenue | – | 3,024 | 210 | 2,304 | – | 5,538 | – | 5,538 | ||||||||||||||||||||
| Demand response services | – | – | – | – | 668 | 668 | – | 668 | ||||||||||||||||||||
| High-performance computing services | – | – | – | – | – | – | 28 | 28 | ||||||||||||||||||||
| Total revenue | 5,860 | 3,024 | 210 | 2,304 | 668 | 12,066 | 28 | 12,094 | ||||||||||||||||||||
| Cost of cryptocurrency mining, exclusive of depreciation | 3,721 | – | – | – | – | 3,721 | – | 3,721 | ||||||||||||||||||||
| Cost of data hosting revenue, exclusive of depreciation | – | 1,736 | 416 | 793 | – | 2,945 | – | 2,945 | ||||||||||||||||||||
| Cost of high-performance computing service revenue | – | – | – | – | – | – | 7 | 7 | ||||||||||||||||||||
| Cost of cryptocurrency mining revenue- depreciation | 2,147 | – | – | – | – | 2,147 | – | 2,147 | ||||||||||||||||||||
| Cost of data hosting revenue- depreciation | – | 569 | 137 | 207 | – | 913 | – | 913 | ||||||||||||||||||||
| Total cost of revenue | 5,868 | 2,305 | 553 | 1,000 | – | 9,726 | 7 | 9,733 | ||||||||||||||||||||
| Gross (loss) profit | $ | (8) | $ | 719 | $ | (343) | $ | 1,304 | $ | 668 | $ | 2,340 | $ | 21 | $ | 2,361 | ||||||||||||
The following table summarizes the balances for the project sites for cryptocurrency mining revenue, data hosting revenue, high-performance computing service revenue, demand response revenue, cost of cryptocurrency mining revenue, exclusive of depreciation, cost of data hosting revenue, exclusive of depreciation, cost of high-performance computing services, and cost of depreciation during the six months ended June 30, 2024:
| Soluna Digital | Soluna Cloud | |||||||||||||||||||||||||||
| (Dollars in thousands) | Project Dorothy 1B | Project Dorothy 1A | Project Sophie | Other | Soluna Digital Subtotal | Project Ada |
Total | |||||||||||||||||||||
| Cryptocurrency mining revenue | $ | 10,880 | $ | – | $ | – | $ | – | $ | 10,880 | $ | – | $ | 10,880 | ||||||||||||||
| Data hosting revenue | – | 7,108 | 3,068 | – | 10,176 | – | 10,176 | |||||||||||||||||||||
| Demand response services | – | – | – | 1,168 | 1,168 | – | 1,168 | |||||||||||||||||||||
| High-performance computing services | – | – | – | – | – | – | – | |||||||||||||||||||||
| Total revenue | 10,880 | 7,108 | 3,068 | 1,168 | 22,224 | – | 22,224 | |||||||||||||||||||||
| Cost of cryptocurrency mining, exclusive of depreciation | $ | 3,724 | – | – | – | 3,724 | – | 3,724 | ||||||||||||||||||||
| Cost of data hosting revenue, exclusive of depreciation | – | 3,495 | 931 | 1 | 4,427 | – | 4,427 | |||||||||||||||||||||
| Cost of high-performance computing service revenue | – | – | – | – | – | – | – | |||||||||||||||||||||
| Cost of cryptocurrency mining revenue- depreciation | 2,152 | – | – | – | 2,152 | – | 2,152 | |||||||||||||||||||||
| Cost of data hosting revenue- depreciation | – | 575 | 302 | – | 877 | – | 877 | |||||||||||||||||||||
| Total cost of revenue | 5,876 | 4,070 | 1,233 | 1 | 11,180 | – | 11,180 | |||||||||||||||||||||
| Gross profit | $ | 5,004 | $ | 3,038 | $ | 1,835 | $ | 1,167 | $ | 11,044 | $ | – | $ | 11,044 | ||||||||||||||
EBITDA and Adjusted EBITDA Tables:
Reconciliations of EBITDA and Adjusted EBITDA to net loss, the most comparable GAAP financial metric, for historical periods are presented in the table below:
| (Dollars in thousands) | Three Months Ended
June 30, |
Six Months Ended
June 30, |
||||||||||
| 2025 | 2024 | 2025 | 2024 | |||||||||
| Net loss | $ | (7,780) | $ | (9,145) | $ | (15,134) | $ | (11,689) | ||||
| Interest expense | 1,196 | 449 | 2,034 | 873 | ||||||||
| Income tax benefit | (608) | (649) | (1,033) | (1,197) | ||||||||
| Depreciation and amortization | 3,989 | 3,909 | 7,868 | 7,834 | ||||||||
| EBITDA | (3,203) | (5,436) | (6,265) | (4,179) | ||||||||
| Adjustments: Non-cash items | ||||||||||||
| Stock-based compensation costs | 1,942 | 1,368 | 3,789 | 2,029 | ||||||||
| Loss on sale of fixed assets | 22 | 21 | 22 | 21 | ||||||||
| Provision for credit losses | – | 244 | – | 244 | ||||||||
| Impairment on fixed assets | 12 | – | 12 | 130 | ||||||||
| Fair value adjustment on SEPA draws | – | – | 118 | – | ||||||||
| Loss (gain) on debt extinguishment and revaluation, net | – | 5,600 | (551) | 8,698 | ||||||||
| Adjusted EBITDA | $ | (1,227) | $ | 1,797 | $ | (2,875) | $ | 6,943 | ||||
The following table represents the Adjusted EBITDA activity between each three-month period from January 1, 2025 through June 30, 2025.
| (Dollars in thousands) | Three months ended
March 31, 2025 |
Three months ended
June 30, 2025 |
||||
| Net loss from continuing operations) | $ | (7,354) | $ | (7,780) | ||
| Interest expense, net | 838 | 1,196 | ||||
| Income tax benefit from continuing operations | (425) | (608) | ||||
| Depreciation and amortization | 3,879 | 3,989 | ||||
| EBITDA | (3,062) | (3,203) | ||||
| Adjustments: Non-cash items | ||||||
| Stock-based compensation costs | 1,847 | 1,942 | ||||
| Loss on sale of fixed assets | – | 22 | ||||
| Impairment on fixed assets | – | 12 | ||||
| Fair value adjustment on SEPA draws | 118 | – | ||||
| Gain on debt extinguishment and revaluation, net | (551) | – | ||||
| Adjusted EBITDA | $ | (1,648) | $ | (1,227) | ||
The following table represents the Adjusted EBITDA activity between each three-month period from January 1, 2024 through December 31, 2024.
| (Dollars in thousands) | Three months ended
March 31, 2024 |
Three months ended
June 30, 2024 |
Three months ended
September 30, 2024 |
Three months ended
December 31, 2024 |
||||||||
| Net loss from continuing operations | $ | (2,544) | $ | (9,145) | $ | (8,093) | $ | (38,518) | ||||
| Interest expense, net | 424 | 449 | 821 | 833 | ||||||||
| Income tax benefit from continuing operations | (548) | (649) | (547) | (743) | ||||||||
| Depreciation and amortization | 3,926 | 3,909 | 3,916 | 3,889 | ||||||||
| EBITDA | 1,258 | (5,436) | (3,903) | (34,539) | ||||||||
| Adjustments: Non-cash items | ||||||||||||
| Stock-based compensation costs | 661 | 1,368 | 1,257 | 2,025 | ||||||||
| Loss on sale of fixed assets | 1 | 21 | – | 9 | ||||||||
| Provision for credit losses | – | 244 | 367 | 149 | ||||||||
| Convertible note inducement expense | – | – | – | 388 | ||||||||
| Placement agent release expense | – | – | – | 1,000 | ||||||||
| Loss on contract | – | – | – | 28,593 | ||||||||
| Impairment on fixed assets | 130 | – | – | – | ||||||||
| Loss (gain) on debt extinguishment and revaluation, net | 3,097 | 5,600 | (1,203) | (145) | ||||||||
| Adjusted EBITDA | $ | 5,147 | $ | 1,797 | $ | (3,482) | $ | (2,520) | ||||